
Is Demand Screeching To A Halt?
Is Demand Screeching To A Halt?
A Look At Key Data Pointing Towards Disinflation
Hey everyone, despite it being a short week this week (happy Good Friday!), there’s a ton of stuff to go over. Today, we’ll take a look at:
ISM Purchasing Managers Index (PMI) reports for the manufacturing and services sectors
Challenger Jobs Report
Nonfarm Payrolls/Unemployment Report
Consumer Credit
Early semiconductor earnings
ISM manufacturing PMI:
The manufacturing ISM PMI data for March came in very weak. The way that PMIs work, a reading above 50 means there’s expansion in that area, and a reading below 50 means there’s contraction. For March, the manufacturing sector had an overall reading of 46.3, which is the third lowest in the past 21 years.
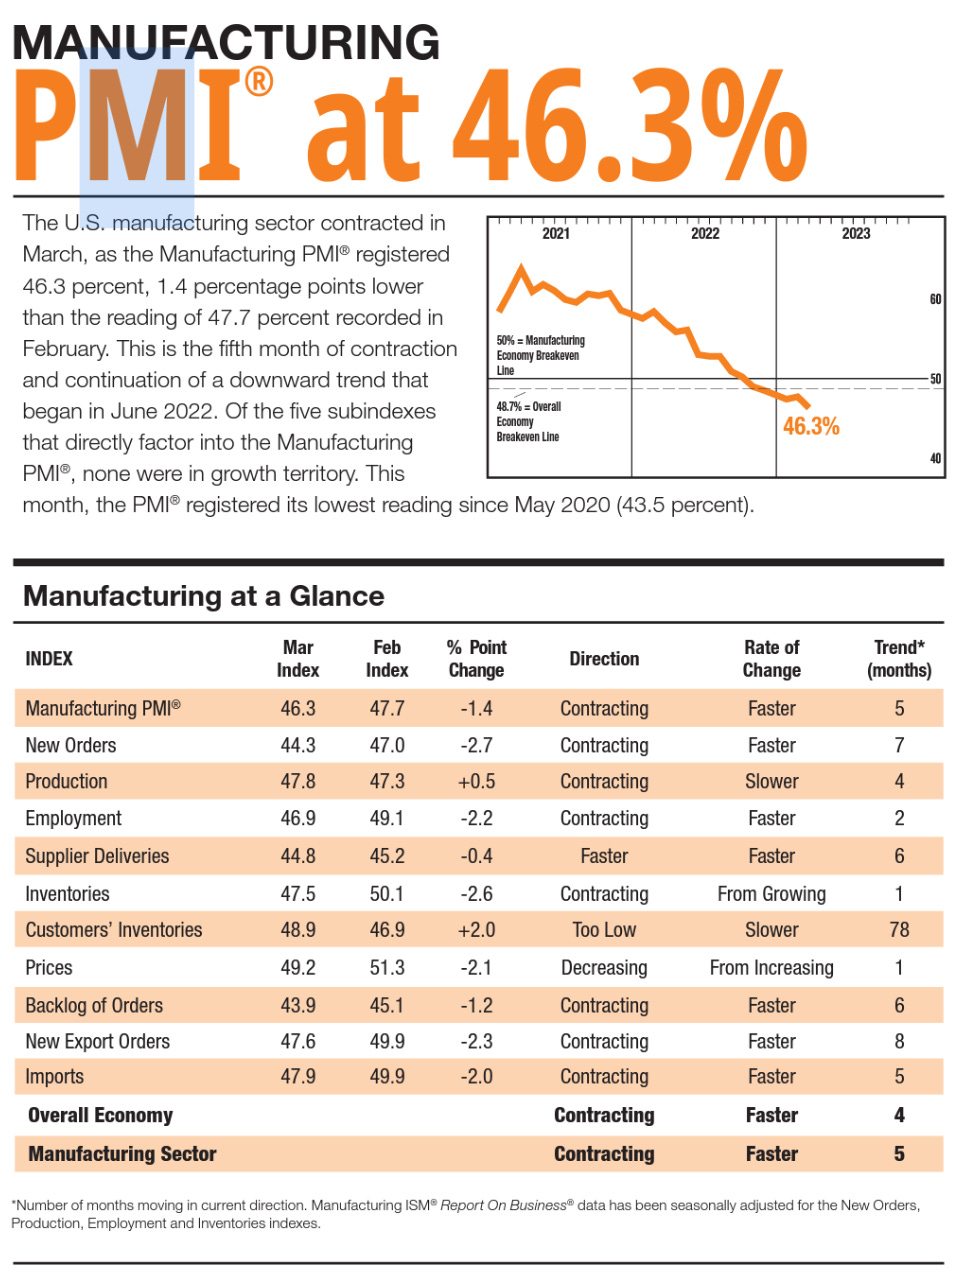
As you can see, every component in the index is below 50, which means each one contracted in March. A couple components that are worth expanding on are inventory, new orders, and employment. Let’s take a look at inventory first:

As you’ll notice, after most of 2022 saw expanding (above 50) inventories, there’s been a decline over the past few months. Judging by the production (47.8) and new orders (44.3) readings, it makes sense that inventories are also in decline.
This can be interpreted in 2 ways:
· Inventories go down because demand is strong and people are buying the excess inventory from 2022
· Inventories go down because demand is weak and companies are realizing this and are scaling back their orders
Based on everything I’m seeing, the answer is undeniably the second option. The clearest way to see this is by looking at the “new orders” PMI component:
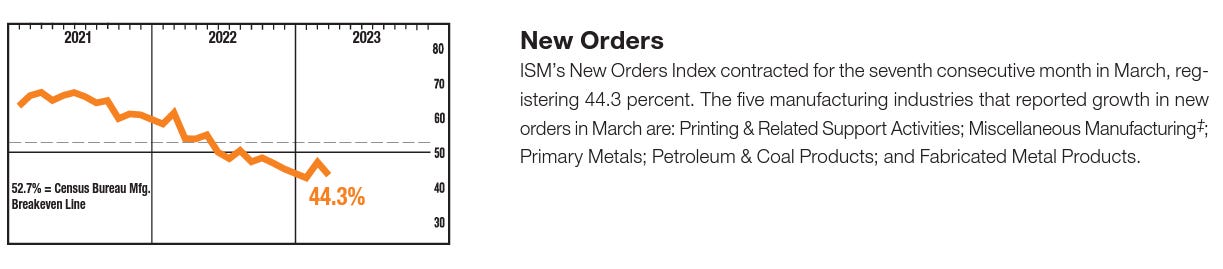
After the reopening, companies were tripping over themselves to order more products, shown by this metric remaining above 60 for most of the year which is highly expansionary. About halfway through 2022, new orders finally moved into contractionary territory. So far, January was the low in the index, but March came close at 44.3, and I doubt we’ve seen the bottom yet.
This is a perfect example of the bullwhip effect, which is when something goes from too far in one direction to too far in the other direction. After economies began to reopen with massive inventory shortages, combined with supply chain interruptions, companies across every industry increased their orders substantially. I’d argue this was a justified response in the immediate term, but they did it for way too long. Now, we’ll see the opposite effect. Managers realize they have way too much stuff, demand is slowing, and they have to cut costs. If the bullwhip effect plays out, they’ll continue to order less until there’s an urgent reason to step orders back up once again.
It’s also worth noting the industries listed in the inventory screenshot as having “high inventory.” These are the areas in the goods economy that are the weakest, as they still can’t clear their shelves despite cutting their orders.
· Printing & Related Support Activities
· Textile Mills
· Nonmetallic Mineral Products
· Paper Products
· Electrical Equipment
· Appliances & Components
· Machinery
· Computer & Electronic Products
Those last 4 are the ones to focus on. What do they all have in common? They use semiconductors. I’ve been pointing out the weakness in the chip industry for over a year now, and despite the action in stocks like SMH, NVDA, etc., I don’t see the fundamental weakness going away anytime soon. We’ll come back to chips later in the article.
Another component that clearly reflects weakening demand is employment:
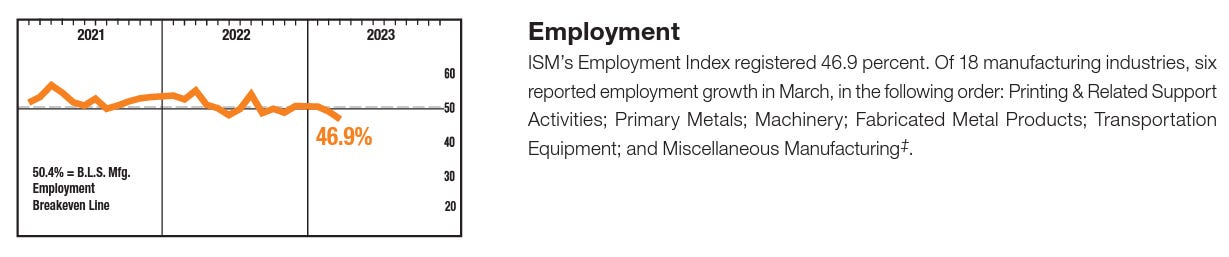
For March, employment came in at 46.9; other than the Covid crash, that’s the lowest reading since 2016. This shows that not only are companies curbing their orders at a rapid rate, but the weakness in demand is also leading to layoffs. This is definitely something to pay attention to, as the manufacturing sector tends to be a leading indicator. As we’ll see in a bit, the labor market in general is still strong, but the weakness in manufacturing could be about 3-6 months ahead of the curve for broader weakening.
ISM non-manufacturing PMI:
Looking now at non-manufacturing (services) PMI, we can see that this sector still grew in March. However, it had a solid move down from February:

Most of the index components are still expanding, meaning the services sector as a whole is growing, but there are a couple things that stand out.
First, imports and exports both went from expansionary to contractionary, making huge drops for March.
New export orders went from 61.7 to 43.7, and imports went from 52.6 to 43.6.
The sharp drop in exports reflects weak international demand, and the low imports reflect either weak international production, weak domestic demand, or both.
Here’s a look at how both have performed over the past couple years:

Neither one has gone below their 2022 lows yet, but it’s worth pointing out that there hasn’t been a month recently where both of them moved down with so much magnitude at the same time.
The new orders component was consistent with exports and imports, moving down from 62.6 to 52.2 in March. So far, the persistence of order growth has been the key differentiator between manufacturing and services, and I’d argue that this component gives us the clearest reading of health in each sector. If orders continue to see weakness in services, it would be a sign that the economy is either in or about to be in a recession, and it would also be vital in bringing inflation down.
On that note, the highest component on the list in March was prices, coming in at 59.5. Granted, it was down a lot from its February reading of 65.6, but there’s clearly still inflation to deal with in the services sector.
Of course, one month doesn’t make a trend, so we’ll have to keep a close eye on future data as well as earnings reports for services-based companies. But if orders continue to go down, we should see prices follow.
Challenger Job Cuts:
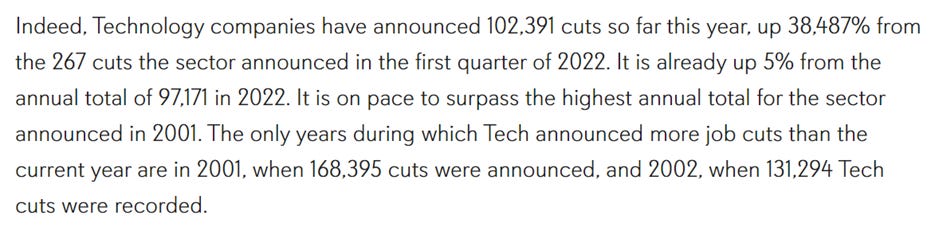
According to this report, there were 270,416 job cuts in Q1, and notably there were more tech layoffs in Q1 than all of 2022:
Almost 40% of the layoffs took place in California, which makes sense because that’s where so many tech jobs are located.
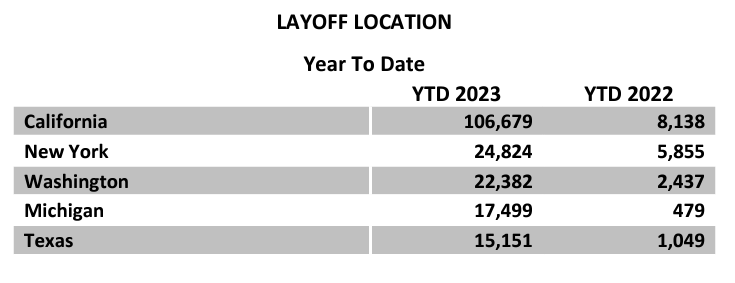
However, recent layoff announcements by companies like WalMart and McDonald’s could be another signal that weakness is expanding into other areas of the economy as well. I don’t expect there to be mass layoffs imminently, but this is something that will increasingly come into focus in the second half of the year
Meanwhile, hiring is slowing:
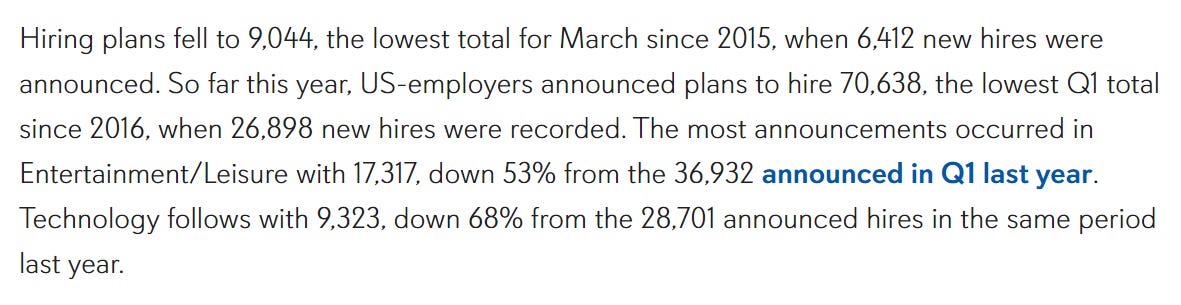
The most notable thing here, considering what we just saw in the services PMI, is that the sector that expects to hire the most people is still Entertainment/Leisure. This is a key part of the services economy and has been the most consistently bullish part of the labor market over the past couple years. However, if we see a consistent drop in demand in services, as the PMI suggests, this sector is probably going to be the hardest hit in the future. Again, I don’t expect this to happen overnight, but I believe it’s likely that we’re going to see it start to play out more clearly in late Q3/early Q4.
Finally, it’s worth noting that these numbers may look big, but considering the labor force is made up of about 167 million people, they didn’t make a dent in unemployment (as we’ll see). However, I still find the Challenger reports useful as a leading indicator, as it can point out weakness in specific sectors and give us an idea of early-stage strengthening/tightening in the jobs market.
Employment Report:
The first thing I noticed about March’s report was that the labor force participation ratio is up once again as more people are looking for work. Judging by the employment numbers, the job market is clearly absorbing all the people either newly entering or re-entering the market.
Over the past year, the number of people in the labor force has gone up by 2.43m, while the total number of employed people has increased by 2.56m.
But why is the labor force participation ratio moving up? Judging by the recent trends in consumer activity, people are re-entering the job market because of economic conditions – they need an income. We’ll get to some of the reasons on this in a little bit. But first, let’s take a look at the payrolls data.
A total of 236k payrolls were added. Here’s a breakdown of payrolls added by sector:
Services: 196k
Government: 47k
Goods: -7k
This is consistent with what we’ve been seeing for over a year: the services sector continues to dominate the jobs market. But considering what we saw in the services PMI, that activity might be starting to slow down. That would be good for inflation, but not the jobs market.
I believe this jobs report will also have a big impact on the Fed’s rate decision when they meet again on May 3rd. The next jobs report isn’t until May 5th, so this is the last employment reading they’ll see until the next rate decision. And since employment still looks strong, I’m thinking we see another rate hike in May.
The final thing to consider is how this will impact inflation. People are clearly not struggling to find work, which has led to consistent spending. The issue is that the source of that spending has moved from personal savings to credit cards as savings remain weak overall. We’re now starting to see some signs that people are finally beginning to curb their spending a bit. If that keeps up, it’ll result in inflation moving down faster, but reduced spending also means reduced incomes for companies.
Two vital things to watch for the rest of 2023 are consumption and credit. If credit becomes less accessible, consumption will have no choice but to subside, and considering that consumption is 70% of GDP, that has consequences.
Other Interesting Things:
Elaborating on why I think people are re-entering the labor force, here are some credit stats from the past week:
Banks are being noticeably tighter with credit since the SVB event (especially with consumer loans):


Credit card spending on retail/food service products went down sharply in March:


CostCo (a “recession-proof” company and one of the strongest retailers in general) reported their first YoY in-store sales decline in 3 years, as well as a 12.7% drop in online sales in March:

Not directly related, but still worth noting: Bankruptcies in Jan/Feb were the highest start to the year since 2011:


Finally, the unemployment rate is still very low, but it’s clear that the jobs market is beginning to tighten a little bit. Considering the slowing activity in the PMIs, Challenger jobs reports, and other regional reports I shared last week, along with the tightening margins I’ve been tracking since mid-2022, some tightening in the jobs market should be expected. I don’t think we’re on the brink of some implosion in the labor market, but if consumer demand continues to contract, so will the labor market. As earnings season approaches, I’m going to be keeping a close eye on discretionary sectors of the market that will get doubly hit by a reduction in demand as well as a forced reduction in prices (deflation) as a response to that reduction in demand. That adds up to a potential disaster for margins, which will speed up labor market contraction, and it seems as though this is becoming a more likely scenario to unfold in Q3/Q4. However, we’ll see further hints of this in Q1 earnings reports.
As I mentioned earlier, a key sector I’m watching is semiconductors. And already, we’ve gotten some data that things look to be getting worse.
There are 3 companies to mention here with regards to their Q1 data:
Micron Technologies:
Revenue down -52.6% YoY
Operating income negative for 2nd straight quarter (went from $2.55b to -$2.217b YoY)
Operating margin down from 32.76% to -60.03% YoY
Samsung:
Sales down -19% YoY
Operating profit down -96%(!) YoY
Operating margin down from 18.2% to 0.95% YoY
Foxconn:
Sales up 4% YoY (March sales down -21% YoY)
They’re a top supplier to Apple – iPhone 14 panel shipments expected to fall 39% in April (suggesting Apple financials will continue to weaken)
The Week Ahead:
Inflation is the core theme of next week, with CPI data coming out Wednesday the 12th and PPI coming out on Thursday the 13th. On Friday, we’ll get a look at retail sales and industrial production for March as well.
Inflation is at a very interesting juncture right now, with energy likely to be deflationary on a year-over-year basis for the first time since January 2021. As for services, which comprise most of CPI, we saw very disinflationary data in the PMI report, but keep in mind that the CPI data is lagging. Therefore, services prices might not come in lower for March, but I believe we’ll start to see that trend unfold in April and May.
Retail sales will be interesting to see as well, especially considering that it also focuses on services. Considering the chart shown above.
That’s all for this week! Thanks for reading, and I hope everyone has a great Easter weekend.
Disclaimer: Everything presented on my Substack is based on my personal research and opinions, and it should never be taken as investment advice. Just because I say good things about a stock or crypto or any investment doesn’t mean it’ll go up (although I wish that were the case). Any action that you take after reading anything on my Substack is your own responsibility.
Great work Ian! Thank you for the info.
Ian, do you think innovation stocks will ever come back?