
Why 2023 Won't Be Kind To The Housing Market
Why 2023 Won't Be Kind To The Housing Market
And 1 Trade Idea To Profit From The Downturn
This year, we’ve seen some crazy things go on in the housing market, and it’s looking increasingly like 2023 will be quite a rough year for homebuilders.
I think it’s been pretty obvious that housing demand is down due to interest rates going parabolic, but prices are still sitting relatively high. Why is that?
This is where the importance of market cycles comes into play; it’s crucial to know leading vs coincident vs lagging indicators, especially in cyclical industries like housing.
With any industry, weakness will start to creep in in certain ways after periods of strength, foreshadowing pain ahead. That’s just the nature of cycles. And if know where to look, you’ll see these trends begin to develop before they’re reflected in a lot of data – of course, I’m referring to leading indicators.
I’ve mentioned leading indicators quite a bit on this Substack, and that’s because they’re so crucial to know if you want to understand trends within the economy, which of course affect the market.
In addition to leading indicators, coincident indicators measure current strength, and lagging indicators are the final data points to fall. Usually, by the time coincident indicators are bad, the market has begun its recovery. That can fool a lot of people, as the emotion of bad economic news can make you think that the market will never recover. In reality, that’s obviously not the case, and if you wait to buy until the lagging indicators are recovering, you’ll miss out on potentially huge gains.
When it comes to housing, these two big leading indicators in housing have been bad for a majority of 2022:
Total units under construction are at 50+ year highs:

Authorized units, or homes where the building process hasn’t started yet, are coming down from 48-year highs:
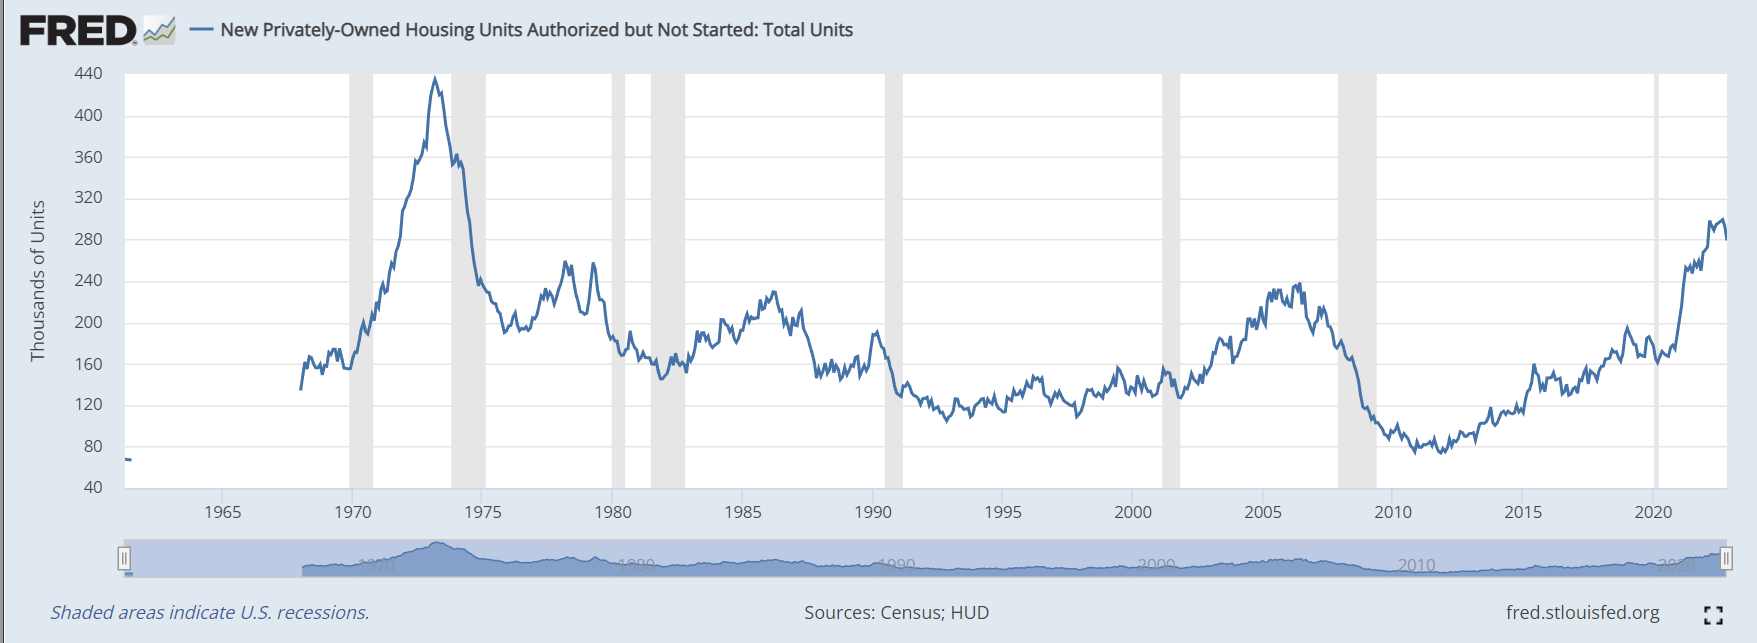
Both of these mean that there’s a huge coming supply glut (units authorized/under construction) in the housing market, at a time when demand (mortgage index) is incredibly low
Also, the MBA Mortgage Market Index, which measures all mortgage applications, is sitting at 25-year lows:
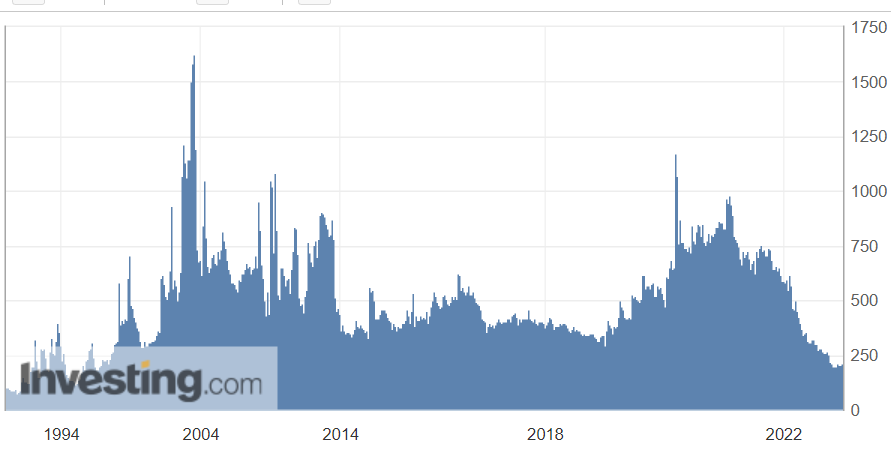
As for the lack of demand for new mortgages, that one should’ve been expected, considering how interest rates have gone parabolic this year.
Now that we’ve seen some leading indicators, let’s look at the most important lagging indicator in housing: home prices.
As we could see via the supply buildup above, home prices are setting up for a sizeable drop in 2023.
Side note: I know a lot of people love to make comparisons to 2008, but that was a generational crash, and the current situation doesn’t look nearly as bad.
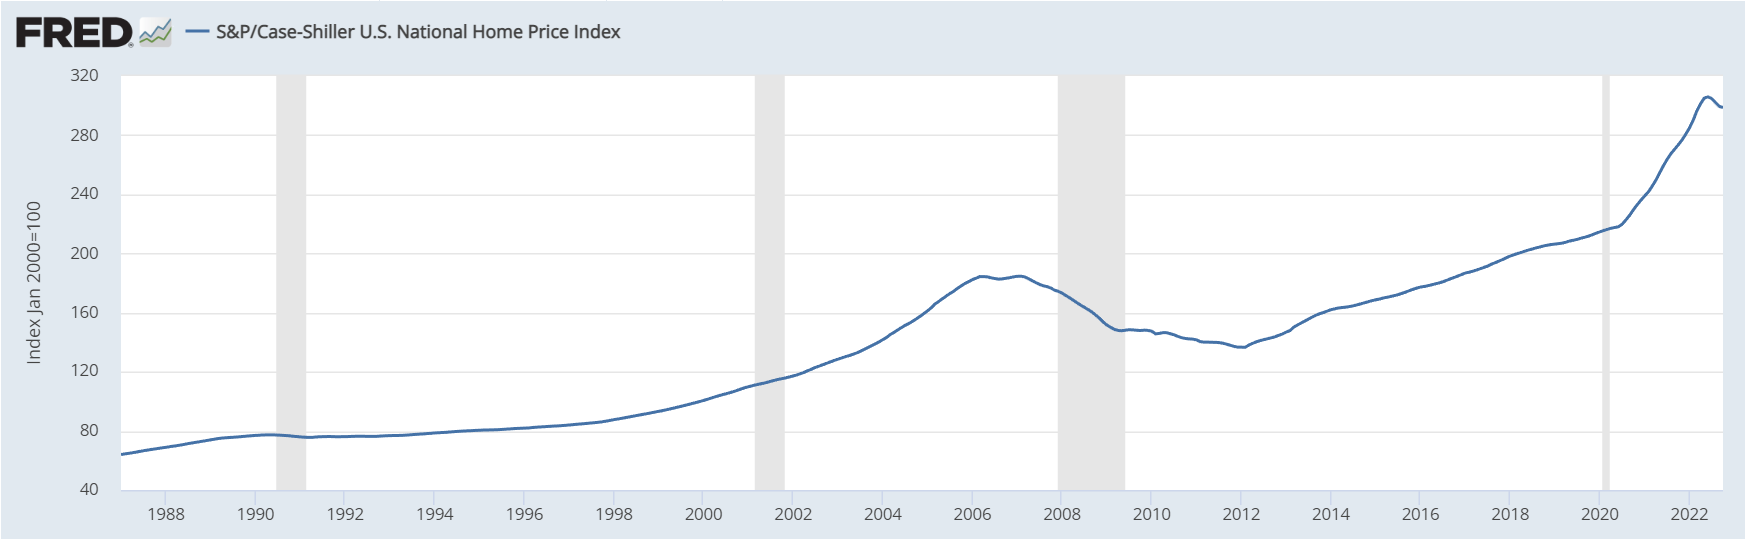
Considering the cracks in the foundation, the Case-Shiller National Home Price Index is still holding impressively steady:
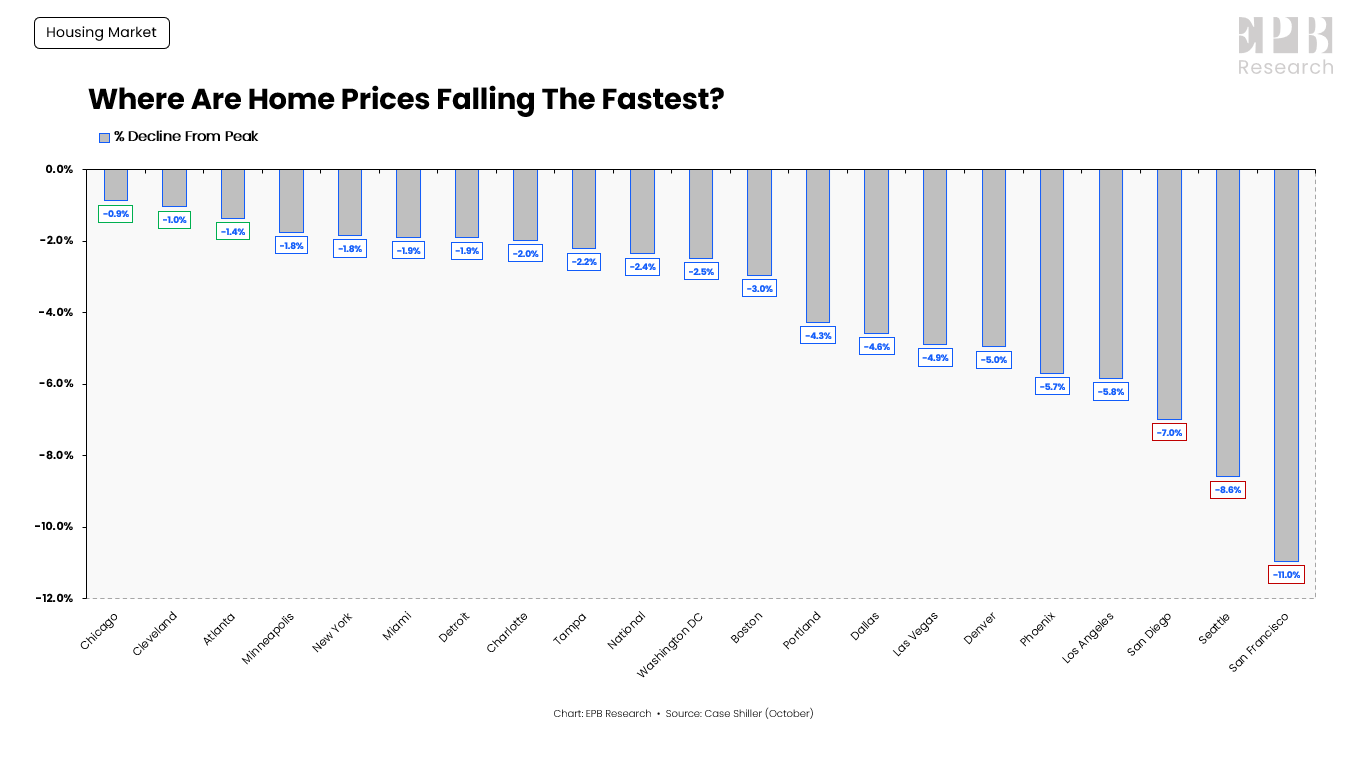
As we can see here, some areas are already seeing declines, but nothing too crazy:
From that data, we can see that the lack of demand for housing hasn’t really hit the homebuilders yet, as they’re the ones who ultimately set the prices.
However, we got a taste of things to come a couple weeks ago when Lennar $LEN reported their Q4 2022 earnings (Lennar’s fiscal Q4 spans from September through November).
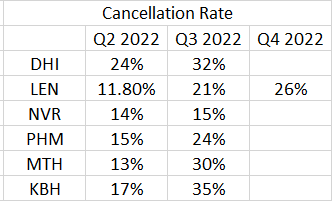
Much like the broader housing market, the leading indicators from their report are nothing short of a disaster; for one thing, they had a 26% cancellation rate vs 11.8% just 6 months prior, which means that over twice as many sales were canceled in Q4 than in Q2.
Lennar isn’t alone in this; many of the top publicly traded homebuilding companies saw major cancellation increases in Q3:
Consequently, new orders (another leading indicator) took a nosedive during Q4. Overall, new orders fell from $7.29b to $5.53b (down 24% year-over-year) in dollar terms, and the number of homes ordered fell from 15,539 to 13,200 (down 15% year-over-year).
When we look at the report’s primary lagging indicators, they of course still paint a semi-positive perspective on the housing market.
Total deliveries in Q4 looked good, with dollar growth from $8b to $9.7b (up 21% year-over-year) and avg sale price went from $448k to $483k (up 8% year-over-year).
However, the cracks are beginning to form in the most important lagging indicator: average sales price. In Q4, this fell from $469k to $419k (down 11% year-over-year)
Wall Street has slowly been pricing in the coming pain in the housing market, as Lennar’s 2023 sales estimates have gone from $35b to $27.8b over the past 7 months. However, it could get a lot worse than that, as analyst estimates are themselves usually a lagging indicator. After all, no analyst on Wall Street wants to risk their job by having an out-of-consensus prediction and being wrong! Therefore, estimates usually are at their worst while stocks are bottoming, and vice versa.
I think at some point in the first half of 2023 we’ll see this reflected in homebuilder revenues and profits, but first, we’ll see it reflected in stock prices.
One way to play this could be buying long-dated put options (the farther out, the safer) on $ITB, the homebuilder ETF. To my surprise, ITB is still holding up compared to a lot of other cyclical sectors, despite the storm clouds growing darker. However, I still feel like the market isn’t pricing in the 30-50% drop in sales along with falling margins that these companies could see next year.
Finally, you should know that options are extremely risky, and whether you want to trade them is completely up to your own personal risk tolerance. This is just an idea based on the data I’m seeing, and it’s not to be taken as investment advice!
Disclaimer: Everything presented on my Substack is based on my personal research and opinions, and it should never be taken as investment advice. Just because I say good things about a stock or crypto or any investment doesn’t mean it’ll go up (although I wish that were the case). Any action that you take after reading anything on my Substack is your own responsibility.
Thank you Ian 🙏🏽 and the very best to you and your family for 2023 and beyond 🤩