
1 Stock for the Housing 🏠 Market
1 Stock for the Housing 🏠 Market
Low liquidity is handing us one BIG opportunity...

Crypto Made ✨ Simple ✨: Making Your First DeFi Trade
In my last Substack, I talked about decentralized finance (DeFi) and what you can do with it…
Now comes the fun part: making your first DeFi trade!
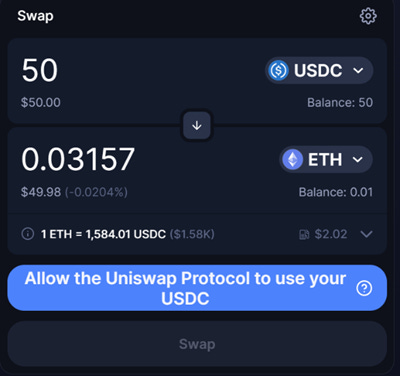
In this example, I’ll be buying ETH with USDC. I’ll specify that I want to spend 50 USDC to buy ETH, and it’ll autofill the amount of ETH that 50 USDC will buy.
But before I make the transaction, I have to give Uniswap permission to use my USDC tokens. This is standard procedure for any DeFi app:
When you click to allow it, you’ll get a Metamask notification requesting you to “sign” for the transaction. The “signature” makes a record of your transaction on the Ethereum blockchain:
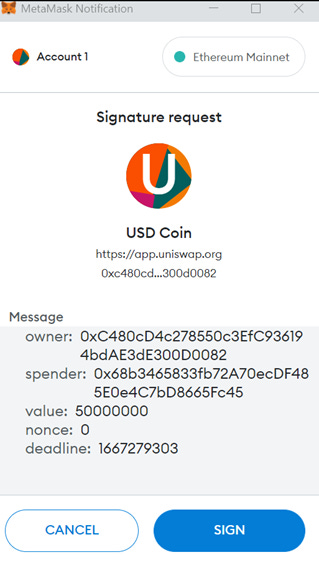
We won’t get into the details of the transaction, but essentially, it’s telling you that you’re buying, Uniswap’s wallet is spending, and it’s being done at a certain time for a certain fee.
After you sign, the “swap” button will light up, and you’ll be able to make the trade. When you click swap, you’ll see a review of your transaction that shows things such as how much you’re sending and receiving, the estimated price, and the fee. It should look like this:
When you hit “confirm swap,” Metamask will show you a similar transaction summary. The main thing here is the fee, also known as the “gas,” which is paid in ETH. This is the final step before your trade goes through.
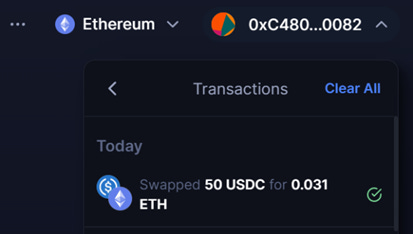
After you hit confirm, Uniswap will tell you that the trade is pending and let you know when it’s confirmed. If you’re not sure whether or not it’s been confirmed, you can click on your address in the top right corner of the Uniswap screen and it’ll show your recent transactions like this:

Congrats! You’ve just made your first DeFi trade. Next time, we’ll go over some more specifics about which tokens you can and can’t hold in your DeFi wallet.
Today’s Agenda 👀
JOLTs Data
UBER 0.00%↑ / ABNB 0.00%↑ Earnings
Housing Earnings
It’s been another crazy week in the world of stocks and macro! So, once again, I’m replacing the usual Friday crypto article with more info on jobs, inflation, the Fed, and earnings season.
Next week, we should be back to the regular schedule of a stocks/macro update on Wednesday and a crypto update on Friday.
If you’d like a quick video summary, look below! 👇

JOLTS Update 🔍
On Tuesday, we got the JOLTs (Job Openings and Labor Turnover) data for August, which showed that the jobs market is still very much alive and well. Overall, the labor market added about 437,000 job openings in September.
More specifically, job openings in the Leisure and Hospitality (L&H) sector went up by 234,000, accounting for more than half of the total job openings increase. In fact, L&H also now makes up 15.2% of total job openings.
Now, I’m sure a lot of this has to do with stocking up on workers in anticipation for the holiday season. And I’m sure that plenty of people wouldn’t mind having that extra income.
So, I expect a lot of these jobs to be filled, which will boost jobs data throughout the rest of the year.
What does this mean?
As I mentioned here, the key to the economy right now is the strength of the jobs market — more specifically, the L&H sector. It’s the most cyclical sector, and it gives us an idea of the demand for discretionary goods.
Put simply, this sector of the economy thrives when people spend money on things like vacations, going out to eat, and entertainment.
And when there’s pain in the economy — specifically when there’s unemployment or inflation — people tend to tighten their budgets and not spend on these sorts of things, resulting in much lower demand for employment within the sector.
However, there’s still a very strong job market and people are willing to spend — even if it’s on credit cards.
In August, the ratio of credit card debt to savings was 1.88. We don’t have the debt numbers for September yet, but personal savings went down about 8.5% in September to $581.6 million.
Other than this past June, that’s the lowest level we’ve seen since October 2009:

Credit card debt will likely be up in September — just as it has been over the past 17 months, pushing the debt/savings ratio over 2 for the first time since September 2008.
That spending suggests that inflation will likely stay relatively high for the time being. While some areas of inflation are weak, such as used cars and energy, a lot are still strong, as I pointed out in this article.
One reference we can use to track the momentum of inflation, which is arguably more important than the level of inflation itself, is the median CPI, which is still making new highs:

As a result, I don’t expect the Fed to backtrack on its rate hike plan, as it continues to point to a strong jobs market to justify its fight against inflation.
Disruptor Earnings 💰
We had two of our three gig economy investments report earlier in the week (the other being PINS 0.00%↑), and we got some incredible results from each one:
1. Uber Technologies Inc. (NYSE: UBER) 🚗
Highlights:
72% sales growth year over year.
$358 million in free cash flow.
18% growth year over year in total trips taken.
1.71 billion total trips taken in Q3.
2. Airbnb Inc. (Nasdaq: ABNB) 🏠
Highlights:
25% growth in total bookings year over year.
20% of total nights booked were long-term stays (28+ days).
29% growth in revenue year over year.
Operating margin grew from 38.06% to 41.72% year over year.
Free cash flow was $960 million.
$9.63 billion in cash versus $1.99 in debt.
It had almost as much cash as total liabilities ($10.54 billion).
Housing Earnings 🏡
Another sector experiencing high sales growth is housing, which is one of the sectors that I said I’d be watching closely this earnings season.
However, if you look beyond the headline data, you can see that the state of these companies has rapidly gotten worse over the past couple of quarters.
Here’s a list of housing stocks, along with their sales, earnings per share (EPS), gross margin, and operating margin that have grown over the past year, as well as since Q1 2020, which I’m using as a pre-COVID reference:
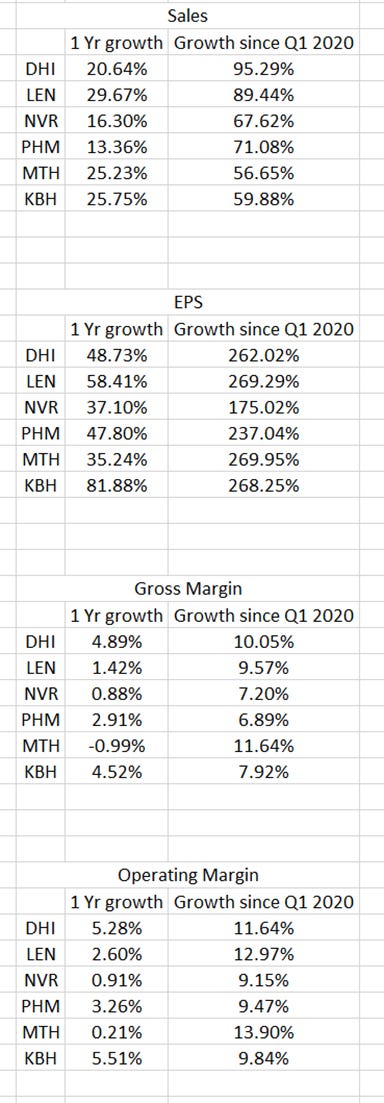
As you can see, these companies are growing sales and margins at a very impressive pace.
Normally, this would be a sign that the sector is healthy, but if we look at some of the leading indicators, we’ll see that this growth probably won’t last much longer.
Here, you can see the following data:
Number of units sold.
Backlog (the value of inventory to be sold).
New orders.
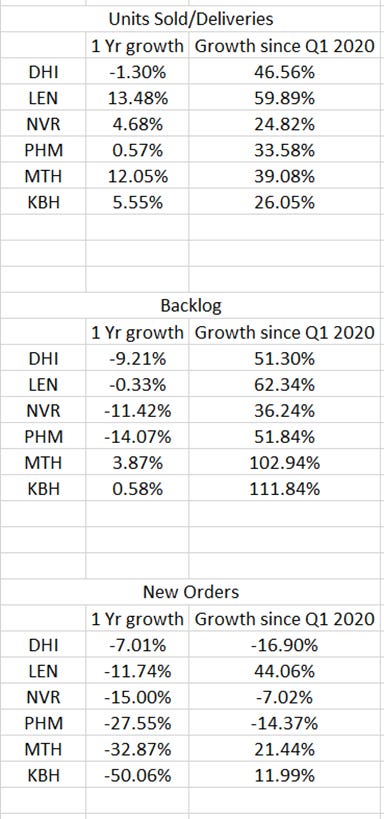
The number of units sold is a coincident indicator, but in my opinion, the other two are pretty strong leading indicators.
New orders, in some cases, are now back below their pre-COVID levels, and we’re starting to see year-over-year declines in backlog as well.
Another number that jumped out at me was the rate at which buyers canceled new orders. This is another leading indicator, and in most cases, it had a huge increase in Q3:
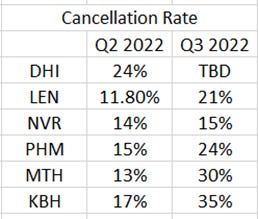
This means that we’re going to see further weakness in new orders in the following quarters.
With housing prices still way higher than they were a year ago, these companies might have another quarter or two left of good sales growth in dollar terms.
But after that, I think we’ll start to see some pain in these numbers as well.
I had a feeling the market wouldn’t start to price this into housing stocks after Q3 reports. So far, I’m right, but each quarter it becomes more likely.
How Can We Profit 💸 From This?
This is the sort of fundamental setup that I look for when trading options.
Not all my trades are based on fundamentals, but the decline in housing over the next six to 18 months seems obvious.
In my opinion, that pain has yet to be priced into these stocks. ITB, which is a popular housing ETF, is still trading above its pre-COVID highs and didn’t make a new low with the indices in October.
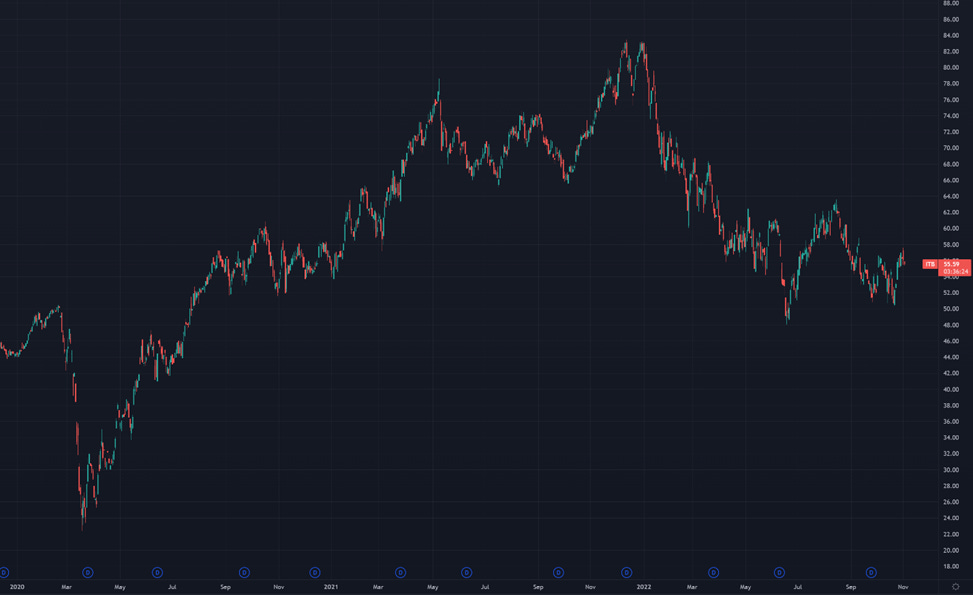
Going forward, I could see it falling quite a bit from here. In a worst-case scenario, it could even crash to the COVID lows — like we’ve seen in some of the tech stocks that have better growth prospects.
Back to the “how to make money” part!
This is an ideal setup for buying put options, which benefit from the decline in a stock’s price.
While most of the trades in our options service will be call options (which benefit from a rising stock price), there are some opportunities for puts that I believe are just too good to pass up.
For that reason, we’re currently holding ITB puts in our options trading service. If you’d like to subscribe, you can sign up here!
#StrongHands 🙌 #BOP 🚀 Nation Update ️️️️️️️️️❤️️
ATG stands for Against the Grain. ATG represents seeing the world for what is abundantly clear to see — an opportunity for incredible growth and the BRIGHT and PROSPEROUS future that lies ahead.
To aid you on your journey to financial freedom, we have five paid plans starting at $9.99 for you to consider. Just visit atgdigital.media to see which plan is the best fit for your journey!
Substack 🥞 subscribers: 1,912 (+21)
Join us, be #BOP 🚀, Be #StrongHands 🙌, #GoATG!
Disclaimer/Legal stuff written in plain English
What you read/watch/hear is OPINION, not financial/investment advice. Treat it no different than when you read/watch/hear your favorite author/YouTuber/podcaster. Despite our best efforts, we get things wrong and make mistakes. Investing is risky. There is no guarantee you will make money. Your investments may lose value. That’s RISK. We cannot give you personalized financial advice because we are NOT financial advisors. It’s on you to decide how much/when/what to buy/sell based on YOUR financial needs, plans, and risk preferences. It's your money and your responsibility.