
What to Look for This Earnings Season
What to Look for This Earnings Season
With such wild swings in the market, it can be hard to know what to watch for. But don't worry, I've got you covered!

· Hydrogen Fuel Cells/Plug Power
· Performance Update
· Jobs Data
· Earnings Season
For a quick summary, click on the video below!

After the roller coaster that was last week, we’re heading into another very eventful time over the next month.
First, we have the highly-anticipated September Consumer Price Index (CPI) coming out tomorrow.
The very next day, JP Morgan kicks off the Q3 earnings season, which will give us plenty of material to go over in the following three weeks. That’ll bring us to the Federal Reserve’s interest rate decision on November 2, which the market is now pricing in yet another 75 basis point rate hike.
Today, I want to go over our play on the hydrogen market, give a quick performance update for the past week, go into some jobs data from last week, and wrap things up with what I’m going to be focusing on during the upcoming earnings season.
Hydrogen
Hydrogen fuel cells are still a very niche market, but they have the extraordinary potential to be a major source of power going forward. They have some key advantages over batteries that make them suitable for heavy machinery, such as construction equipment…
First, they’re very light, whereas batteries are extremely heavy. And second, they don’t need to be re-charged. Instead, you just change their fuel like you would with a gas-powered vehicle. Right now, the dominant application for hydrogen fuel cells is forklifts, so it’ll surprise me if we see more heavy machinery begin to use them as well.
Plug Power Inc.
PLUG 0.00%↑ Plug Power Inc. (Nasdaq: PLUG) was one of the first players in the hydrogen game, and its ability to be early has paid off immensely over the past few years.
It originally caught my eye all the way back in 2016, when it signed a deal to supply Amazon with fuel cells to power its forklifts. Since then, it’s been a key supplier of fuel cells to Amazon and Walmart, two of the largest companies on the planet.
Right now, PLUG 0.00%↑ is in the middle of a rapid growth phase. It’s expanding its product line and building massive facilities in the U.S. and Europe so it can meet future demand.
One metric that stood out to me in its most recent earnings report was that 37% of its revenue was generated by new products.
This shows that the company understands its customers’ needs, as well as the needs of the market in general. And as it expands its product line, this should continue to be the case.
This rapid growth phase is clear when you look at the company’s sales growth over the past five years.
In 2017, it brought in $99 million in sales. That grew by a massive 403% to $502 million in 2021. Total sales for 2022 are expected to be $918 million, which would be 83% growth from 2021.
At this point, the one thing PLUG 0.00%↑ doesn’t have is positive cash flow. However, PLUG 0.00%↑ prepared for this by doing a massive series of stock offerings. From September 2020 through May 2021, the company sold a total of $4.9 billion worth of stock.
In the short-term, this put a ton of selling pressure on the stock. But fortunately, the market was able to absorb this relatively well — showing there was very strong demand for the stock.
In hindsight, PLUG 0.00%↑ made the right decision. It got enough cash from that deal to last several years as it scales its business. Currently, PLUG 0.00%↑ still has about $3.1 billion in cash and just $538 million in debt, giving it lots of room to continue funding growth.
PLUG 0.00%↑, along with more than 40 growth stocks with rocketing potential, are in our Profits Unlimited Portfolio. For access and guidance on these stocks, subscribe to our Silver Membership for as little as $9.99.
Performance Update:
Performance:
Disruptors Index: -2.23%
S&P 500: 0.86%
Nasdaq: -0.32%
Russell 2000: 1.66%
ARKK: -3.79%
Top 3 Performers:
MP Materials Corp. (NYSE: MP) +11.06%
Pinterest Inc. (NYSE: PINS) +5.79%
Airbnb Inc. (Nasdaq: ABNB) +5.66%
Bottom 3 Performers:
Tesla Inc. (Nasdaq: TSLA) -15.94%
DocuSign Inc. (Nasdaq: DOCU) -13.47%
The Trade Desk Inc. (Nasdaq: TTD) -8.23%
Overall, it was a pretty mixed week in the market. The Russell 2000 was the top performer, outpacing the Disruptors by 3.89% and ARKK by 5.45%.
I thought that was interesting since the Russell 2000 is seen as a growth-heavy index, but its performance was very different from our stocks.
The gig economy stocks had a solid week, with PINS 0.00%↑ Pinterest Inc. (NYSE: PINS), ABNB 0.00%↑ Airbnb Inc. (Nasdaq: ABNB), and UBER 0.00%↑ Uber Technologies Inc. (NYSE: UBER) all in the green.
It was also good to see MP 0.00%↑ MP Materials Corp. (NYSE: MP) rebound from making a 52-week low on September 30. It was also positive on Monday this week, along with LTHM 0.00%↑ Livent Corporation (NYSE: LTHM) and ENPH 0.00%↑ Enphase Energy Inc. (Nasdaq: ENPH), while most growth was deep in the red.
One of the benefits of holding some energy-related stocks in our portfolio is that they don’t tend to follow the price of growth stocks, and have supported our portfolio on quite a few red days already.
TSLA 0.00%↑ Tesla Inc. (Nasdaq: TSLA) was the worst performer in the index for the second straight week. It’s now moved down by 29% in the past 14 trading days, putting it right near its lows of the year.
Despite growth in deliveries and sales, TSLA 0.00%↑ hasn’t been able to avoid the onslaught of selling that — at this point — has affected just about every corner of the market. It reports earnings one week from today … and you can be sure I’ll update everyone on that once it goes out!
Jobs Data
Last week was full of jobs data releases, and there are two I want to focus on: the JOLTs (job openings) release on Tuesday and the Unemployment Report on Friday.
First, it’s important to see economic data from the perspective of the market. Bad news isn’t always bad, and good news isn’t always good.
Right now, I believe the market wants to see employment data get worse, as it’s believed that a weak labor market means a Fed pivot.
While it’s true that the Fed has been using the labor market as its primary gauge on the health of the economy, I think we’re going to have to see months of deterioration before any pivot is made.
On top of that, we’re going to have to see months of data where inflation (especially core inflation) is moving down sharply on a monthly basis. Neither thing has happened yet, so we still have to take it one day at a time.
That being said, something like a pension fund meltdown or other huge systemic event might cause them to pivot in the meantime. But again, we have to take it one day at a time.
JOLTs
On Tuesday, it was reported that total job openings were down over 1.1 million in August. That’s a huge decline for a single month. To put that in perspective, the expected job openings decline was 464,000 … so it was over twice as bad as expected.
Like any economic datapoint, the headline number can be misleading, so it’s vital to look at the underlying trends. With the JOLTs report, leisure and hospitality (L&H) is the most cyclical sector, so you can get the best sense of where the economy is by looking at that.
Because this is purely a discretionary part of the economy, it thrives on people having excess money to spend.
However, even though that hasn’t been the case for several months, the L&H jobs market still looks pretty strong (according to the August data, at least):

Source: U.S. Bureau of Labor Statistics
In fact, the L&H sector is still the second-largest employer in the U.S., comprising about 14% of total job listings. I’m not sure about you, but that doesn’t exactly scream “demand destruction” to me just yet.
I know I keep bringing this up every week, but the most confusing thing about the L&H strength is that personal savings are all but wiped out.
However, people continue to spend via credit cards. And while it might not be the most pleasant thing to expect, I don’t see that trend going away without pain in the jobs market.
Unemployment
On Friday, we saw that the aforementioned pain in the jobs market is not yet here. Unemployment went back down to 3.5%, as the huge inflow of people into the workforce that I mentioned here had no problem finding jobs right away.
Looking at the numbers, the number of employed people jumped by 204,000 and the number of unemployed people decreased by 261,000. That adds up to a net gain of 465,000, which was enough to move the unemployment needle by 0.2%.
If that’s not a healthy labor market, I don’t know what is!
We also saw that real wages (accounting for inflation) are still in freefall, as average hourly earnings are only up 5% over the past year and average weekly earnings are only up 4%. Considering inflation is still over 8%, the consumer outlook isn’t getting any better.
If food prices stay high, and energy prices continue to climb back up, we could see even more savings get wiped out.
Right now, the job market is telling us something: Jobs are easy to come by, but a lot of them are on fragile footing.
If we see inflation stay high (especially energy prices), we’ll see companies lay people off, as they won’t have enough to pay them (let alone at the pace of inflation). If layoffs become more severe, we’ll see a drastic reduction in L&H and other cyclical jobs/listings, as well as a slowdown in discretionary spending.
To me, this is still the most likely path forward.
Earnings Season
Last Thursday, AMD 0.00%↑ Advanced Micro Devices Inc. (Nasdaq: AMD) surprised the market when it released Q3 earnings numbers early — and way below Wall Street’s expectations.
Forecasts called for AMD 0.00%↑ to bring in about $6.69 billion in sales, but it announced total revenue of “only” $5.6 billion — a 16% difference.
And while that’s definitely not something to celebrate, it should still be mentioned that the company’s sales grew 29% over the prior year.
Going back to June, MU 0.00%↑ Micron Technology Inc. (Nasdaq: MU), another chip company, made a very similar early earnings announcement. It was one of the first cracks we saw in the overall earnings picture of 2022.
Since then, MU 0.00%↑'s 2022 sales estimates have been cut in half.
Given that chips are a very cyclical industry, I think this should be top-of-mind as we head into the Q3 season.
In addition to semiconductors, I’m planning on focusing a lot of my attention on earnings data from the retail and housing sectors.
Retail Earnings
From retail, I’m looking for insight on two things:
How are big retail companies managing all this extra inventory?
Will they be able to continue paying dividends and share buybacks?
These two questions are somewhat related. If companies can’t sell their products — or have to run significant discounts to sell them — they’re going to have a tough time generating enough cash to fund their operations, let alone all the extra stuff, like dividends/share buybacks.
The alternative way of generating the cash has been selling bonds (a.k.a. going into debt). But with rates moving the way they are, I don’t expect that to be a very popular option.
Another thing I’m interested in is seeing whether or not retailers’ top-line sales are affected.
So far, we’ve seen nearly all the financial damage hit their margins — meaning they haven’t been nearly as profitable — while their sales figures have remained positive.
For example, NKE 0.00%↑ NIKE Inc. (NYSE: NKE) recently reported 3.58% sales growth over the past year, but its earnings (profits) declined by 19.83%.
I’m not saying 3.58% sales growth is anything special, especially when inflation is where it is. But at some point, I expect to see sales numbers get hit along with profits.
This relates back to the discretionary spending issue. Since the CPI and PCE data are lagging data, we might actually see consumer weakness accelerate first in earnings reports before it shows up in the initial inflation data.
Housing Earnings
Here’s one example of just how lagging the inflation data is: The CPI’s housing metric of Owner’s Equivalent Rent (OER) is still going up steadily month after month despite the median sales price of homes going down 5.9% from June through August:

Source: National Association of Realtors
While they’re in decline, you can see that the prices are still much higher than a year ago. That doesn’t capture the pain felt by the housing market thus far, but overall mortgage applications do.
Take a look at the U.S. MBA Purchase Index, which tracks the entire market of mortgage applications:
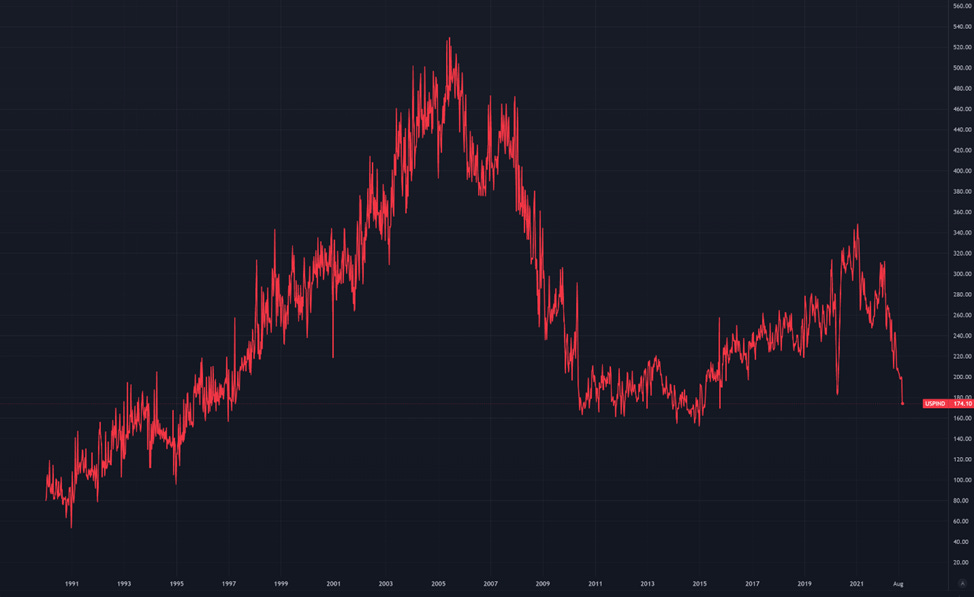
Source: TradingView
Put simply, this weekly index shows that demand for housing has fallen off of a cliff. In fact, last week, there was a 12.6% decline, which was the fourth-worst drop in more than 13 years.
So, it’s clear that demand for new housing is crushed. However, the Q3 earnings reports for housing stocks might not capture much of this damage at all.
The reason I saw that is because of a recent report by Lennar, one of the bigger housing companies out there.
In Q3, which was from May to August, its sales actually grew by almost 29%. And its earnings per share (EPS) went up 58.4% from a year earlier. Under the surface, though, its sale cancellation rate has been growing. Cancellation rates hit a multi-year high of 21% in Q3, which is relatively high.
Now, not all housing companies are as strong as Lennar, but overall, I wouldn’t expect sales growth across the board to be too bad for the industry. Once again, we have to look at this from the perspective of the stock market.
I think the chart above is pretty telling. The housing market is drying up at a rapid pace. With the Fed set to raise rates again twice more this year, I think this trend will only get worse.
Investors know the housing market is in really bad shape. Whether or not a company had a good Q3 is almost irrelevant at this point. What people want to know is what’s going to happen over the next six to 12 months.
For that reason, the most likely scenario is that housing companies report good growth, but their stocks move down as people continue to discount the future.
Conclusion
How does all this apply to our portfolio?
First, the three industries I mentioned in this article are all highly cyclical. In the 21 Disruptors Index, I focus mainly on companies that aren’t as cyclical — or have a different cycle.
For example, energy commodity companies are cyclical. But I believe we’re at the start of a giant cycle in markets like nuclear, energy storage, and — on a broader scale — U.S.-centered production.
Another area of the portfolio that could be considered highly cyclical is the gig economy section, where we have PINS 0.00%↑, ABNB 0.00%↑, and UBER 0.00%↑. But what a lot of people miss is that those companies are also sources of extra income for people, which will be in high demand in a recession.
As more people use those companies to make more money, it’ll push down the prices and, in many cases, will be a relatively cheap option for potential customers.
It’s also important to have companies that do most, if not all, of their business in the U.S. That’s because, right now, the strength of the dollar is acting against all of the multi-national companies that make up the stock indices.
In fact, about 40% of all revenue made by S&P 500 companies is in foreign currencies. On the other hand, just about all the money brought in by our stocks is in dollars.
Finally, it’s important to avoid companies that rely on debt to finance their operations. Instead, this is the time to own companies that bring in sufficient cash to pay their bills, grow their business, and have a decent amount left over.
With rates going parabolic, the companies that are too reliant on debt are going to struggle more and more to survive. As we can see here, distressed loans jumped dramatically in September:

Source: Twitter
This chart shows the total value of leveraged debt that’s down 20% or more from its original value. In fact, distressed loan volume now makes up about 6% of the entire leveraged loan index, and over 20% of loans are now down 10% or more:

Source: Twitter
This is what the companies that were already crumbling are dealing with. And the “Investment Grade” debt isn’t looking so hot either:

Source: Twitter
Bottom line: Investors are shying away from debt, and banks are becoming less willing to lend it out. That means companies won’t be able to get their debt fixes anymore, which won’t bode well for their finances.
But again, this isn’t a problem if you invest in cash-heavy and debt-light businesses.
To sum it all up, these are the goals of the Disruptors Index:
Avoid companies in the late stages of their business cycle.
Avoid companies that are highly exposed to foreign currencies.
Avoid companies that are reliant on debt to fund their operations.
That’s all I have for you today, but I’ll be back on Friday with another Substack!
Thank you, Ian, for this thorough updates, looking forward to your next one. thanks again for your wise insights.
Thank you Ian. A content rich and insightful article as always. This helps me understand the background details supporting what you have been and are saying about legacy companies and our growth stocks and what is likely just ahead for our next bull run. It’s an exciting time.