
How to Navigate the Current Market
How to Navigate the Current Market
Market up, market down! Volatility is no fun ⎯ but there's a way to navigate the volatility we're seeing in the market.

When it comes to innovation, the companies that draw the most public appeal are the ones who make the flashy, state-of-the-art stuff.
And while they definitely deserve some credit, it’s lesser-known that they wouldn’t be around without the ones making the actual innovation possible — that is, the companies that design, simulate, and test all the newest and best machines that make our world more efficient and exciting.
These form the foundation upon which all innovative trends are able to grow, from self-driving cars to industrial robots — even new forms of cancer diagnostics and treatment.
Today, we’re taking a look at two examples of disruptors that fly under the radar, but are crucial to innovation. For a quick overview, feel free to watch the video below:

Disruptors: CDNS and PTC
Cadence Design Systems Inc. (Nasdaq: CDNS) and PTC Inc. (Nasdaq: PTC) are both leaders in one of the most underrated fields in tech (in my opinion, at least): the product design/simulation field.
Companies like these are necessary because they can rapidly speed up the process of creating all sorts of really cool and useful things.
CDNS’s technology, for example, helps all sorts of sensors in self-driving cars collect data, creates memory systems for AI, and even simulates the effectiveness of future medical treatments.
PTC is just as impressive.
Their technology allows technicians to train by building and repairing machines in augmented reality (basically simulating the real thing with a hologram). It also creates a way for machinery to communicate with engineers, other machines when they’re due for maintenance, or to limit unnecessary energy use.
Because of companies like these, the speed of technological advancements is far faster than it would be otherwise, and who knows where we’d be without them.
In fact, if you pick any field of cutting-edge technology, CDNS and PTC are likely working in them.
It’s no question that their services are absolutely necessary in today’s world, but that doesn’t automatically make a company a good investment. They need to have a solid financial position as well — which CDNS and PTC thankfully have!
Like any other growth stock, cash is extremely important. It’s the fuel needed to grow a business and, without it, you’d need to rely on debt or massive amounts of stock issuance (also known as share dilution), both of which are less than ideal.
CDNS has no shortage of cash, with $1.03 billion as of their last earnings report. They also have huge and consistent incoming cash flows, raking in $1.17 billion from operations over the past year.
What’s even better is their relatively tiny amount of long-term debt, sitting at “only” $348 million. That sounds like a lot, but if they wanted to pay it off overnight, they could!
PTC has one of my favorite things to see in a growth stock: an up-and-coming part of their business that’s currently small but becoming more and more important in driving overall sales growth.
This would be their “Velocity” business segment, which consists of technologies such as augmented reality and enabling people around the world to collaborate on high-detail product simulations.
Velocity’s revenue is up 62% over the past year, and even though this segment of their business is tiny, it represented $8.3 million of their $26.8 million sales growth in Q2.
PTC has more debt than most on this list with about $1.43 billion, which is way more than their cash balance. However, over 70% of their debt isn’t due for another three to six years.
Fortunately, they also have very strong cash flow. In fact, they’ve brought in $259.1 million so far in operating cash flow during the first half of 2022, which is their best first half in company history.
Considering the value of their products to the advancement of technology in general, I don’t think they’ll have any issue paying that debt off when the time comes.
21 Disruptors Index
Performance:
21 Disruptors Index: +10.54%
S&P 500: +4.77%
Nasdaq: +5.27%
Russell 2000: +5.35%
ARKK: +12.54%
Top 3 Performers:
DocuSign Inc. (Nasdaq: DOCU) +20.69%
Guardant Health Inc. (Nasdaq: GH) +17.58%
Bitcoin (BTC) +17.44%
Bottom 3 Performers:
Energy Fuels Inc. (NYSE: UUUU) +3.84%
Cadence Design Systems Inc. (Nasdaq: CDNS) +4.24%
Enphase Energy Inc. (Nasdaq: ENPH) +4.68%
It was an extraordinarily green week for the markets, nonetheless.
The Disruptors Index still more than doubled the return of the S&P 500 and was exactly twice that of the Nasdaq. The Ark Innovation Fund came out on top overall, but don’t let that take away from the fact that 11 out of the 21 holdings in our index were up double digits!
We also saw new highs made by two Disruptors, Enphase Energy Inc. (Nasdaq: ENPH) and Livent Corporation (NYSE: LTHM).
I think this is pretty impressive, to say the least, considering how few highs are being made right now in the overall market.
Between the entire NYSE and Nasdaq, only 29 stocks made a new high (including ENPH) last Wednesday, and only 42 made a new high (including ENPH and LTHM) last Thursday.
DOCU Earnings
The top performer during the past week was DocuSign Inc. (Nasdaq: DOCU), which had a major move up after reporting their Q2 earnings.
One of the main things that distinguish this crash in growth stocks from the dot-com crash is the fact that the sales of most of those tech companies actually started going down a couple years out.
While there may be some here and there that experience lower sales in the current market, companies like DOCU are as close to a sure thing as you can get in terms of sales growth.
They have a product that has a widespread and well-defined use case and, most importantly, they’re the leader in their market.
To me, it’s very hard to not like DOCU when it’s this cheap and solves a problem that everyone wants solved: dealing with paperwork.
DOCU came out with yet another great quarterly earnings report last Thursday, showing 22% sales growth. Not only do they have good sales growth, they also have consistently positive operating cash flow, which is extremely valuable for high-growth companies.
Last quarter, they brought in $196.3 million in operating cash flow, and they now have a total of $1.13 billion in cash on their books.
Economic Indicators: Leading vs. Coincident vs. Lagging
Every month, The Conference Board comes out with a report that shows how the economy is doing based on leading, coincident, and lagging indicators. This is very useful information, as it takes a lot of data and compacts it into a single metric.
For example, if the leading index is in a strong uptrend and the lagging index is in a strong downtrend, it means that you’re likely going through an economic recovery.
In that situation, the worst is probably behind you, because the things that forecast the future economic situation (leading) are strong, even though the data points that tend to stay weak for a while during a recovery (lagging) are still down.
The Leading Economic Index (LEI) is made up of things like:
· Weekly jobless claims.
· Manufacturers’ new orders.
· Building permits for private housing.
The Coincident Economic Index (CEI) is made up of things like:
· Industrial production.
· Nonfarm payrolls.
· Manufacturing and trade sales.
The Lagging Economic Index (LAG) is made up of things like:
· Services CPI monthly change.
· The ratio of consumer credit to personal income.
· The value of outstanding commercial and industrial loans.
I won’t list them all in this article, but if you’re interested in seeing the full list, you can do so here.
As advertised, you can see that the LEI peaks before CEI in the following chart:
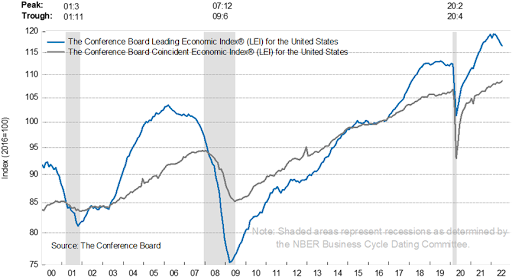
Right now, we’re seeing this situation unfold again, where LEI is sharply down while CEI is still moving up. Over the past six months, here’s how the LEI, CEI, and LAG have performed (there’s a clear trend here):
LEI down 1.6%
CEI up 0.8%
LAG up 3.7%
As you can see, this is the exact opposite of the scenario I explained above. And right now, these indicators are flashing warning signs.
If you take the fact that the LEI is down 1.6% in six months and expand that over a year, you’ll get a decline of 3.23%. The magnitude of that sort of drop is put into context in this chart, where it’s on par with declines that were seen in 2000, 2006, 2008, and 2020:
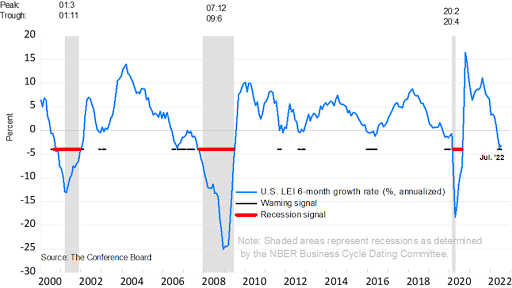
Even though the LEI is still historically high, the fact that it’s come down so sharply is a clear sign that the economy is very fragile.
In other words, this isn’t exactly the best time to raise interest rates from nearly 0% to 3% in six months (assuming the Fed raises at least 50 basis points later this month).
As I’ve pointed out before, the one saving grace for the economy right now is the job market. There’s no denying the strength here, as there’s currently about 1.87 job openings for every unemployed person in the labor force.
Source: TradingView
Even if you took all the unemployed people that dropped out of the labor force after the COVID lockdowns — as well as those who’ve turned 16 since then and are now included in the employable population (I went into why this is increasingly important in last week’s article) — there would still be more job openings than unemployed people.
I’m not sure when this was last the case, but if it’s happened before, it was a really long time ago. This is a historically strong job market.
I don’t see this strength changing too much over the next six months or so, but there are a couple things to watch out for…
First, if interest rates stay high, it’s going to hurt the big companies that are so reliant on debt (and also hire the most people). Lots of companies rely on debt to pay dividends and fund share buybacks, and in some extreme cases, they need it to pay their regular bills.
A lot of these companies haven’t taken on additional debt since the huge stimulus payments of 2020. Not only did they get lots of cash, they also got the opportunity to take out a ton of debt at extremely low rates.
Now that rates are substantially higher, when the time comes to take out more loans, they’re going to be hit with much higher interest payments.
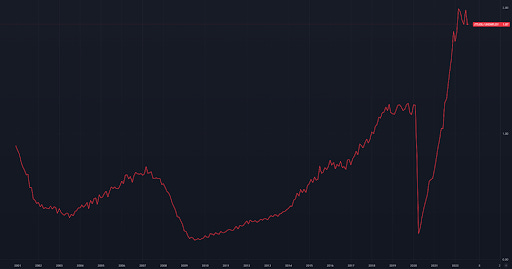
To add insult to injury, it’s very possible that banks might even deem them unfit for future loans! As noted above, loan activity is a lagging indicator. Why is that, you may ask?
It’s because companies (as well as people) tend to take out lots of debt when they’re short on cash. So, when the economy is already in rough shape, you’ll see debt numbers start to go up faster.
In fact, total commercial and industrial loans — which basically just means total loans to businesses — peaked in February 2001, October 2008, and May 2020:

Source: TradingView
As you can see, loans are back in a strong uptrend, but this time might be different.
That’s because we’re now starting to see banks rapidly tightening their loaning standards, which basically means they’re not giving out money as easily anymore:

Now, the time is approaching when these companies will blow through all the stimulus money and low-interest loans — which they got in 2020 — on record share buybacks and dividends, and, more recently, energy costs.
Sooner or later, they’re going to need to take out more debt, and not only will it be harder to do so, but the interest rates will also be higher.
Of course, this is one of the main reasons I’m such a fan of stocks with high sales growth, lots of cash, low debt, and positive cash flow.
The second thing to watch out for is energy prices.
Oil and gasoline have seen pretty big price declines over the past several months, but they can be very unpredictable in the short term. Meanwhile, the price of natural gas is still over twice as high as it was at the beginning of 2022.
That means the electric bills for companies that have huge warehouses, stores, and data facilities are still high. The bottom line is that if energy prices stay high, it’s going to be hard for companies to continue to increase their pay at the rate of inflation.
Again, I don’t see this being an issue for the economy as a whole in the near future, but as millions of people come back into the job market, high energy costs and high interest rates put a lot of companies in danger of removing job openings and laying people off down the road.
All in all, there are still an incredible number of uncertainties in the economy. Right now, the focus in the market is on inflation (and by the time you read this, August CPI data will be out).
If energy prices stay low and inflation comes down on a monthly basis, we’ll probably see the markets move higher — at least until the market finds something else to worry about. (October earnings season? November Fed meeting? Who knows!)
We have a very strange mix of high inflation, a strong job market, rapidly depleting personal savings, and a rapid increase in interest rates.
There’s certainly no shortage of questions in today’s economy, but here are a few that should be at the top of any investor’s mind:
How much wage inflation can companies afford to take?
How easily will the market absorb several million “new” workers?
And potentially the most important, which areas of the economy will be hurt by banks as they keep tightening lending standards?
That’s all for today, but if you’re in the market for a solid stock pick, consider watching Paul’s latest YouTube video:

If you’re new here, don’t forget to subscribe!
Thanks Ian for the update,. It's very insightful.
This info is amazing!! I’m trying to make myself a simple key visual - Not sure I understand where the Philly Fed falls in the mix?