
The Market Is Bored Of Inflation
The Market Is Bored Of Inflation
What's going to get its attention next?
Yesterday’s CPI Report
Yesterday, the much-anticipated December CPI data came out, and it was pretty much on-par with expectations:
Total CPI YoY – up 6.5% vs 6.5% estimate
Total CPI MoM – down 0.1% vs 0.0% estimate
Core CPI YoY – up 5.7% vs 5.7% estimate
Core CPI MoM – up 0.3% vs 0.3% estimate
In case you missed it, I highlighted the fact that the manufacturing sector of the economy is experiencing deflation across many levels of the supply chain here. However, manufacturing is somewhat underrepresented in the CPI, and there are other places that are set to see yearly deflation as well.
The most prominent of these is energy. Over the next 3 months, we’re almost certainly going to see YoY numbers for energy inflation plummet.
The energy component for December was down 4.5% MoM, but is still up by 7.3% YoY. As you can see in this chart, we’re getting very close to January levels:
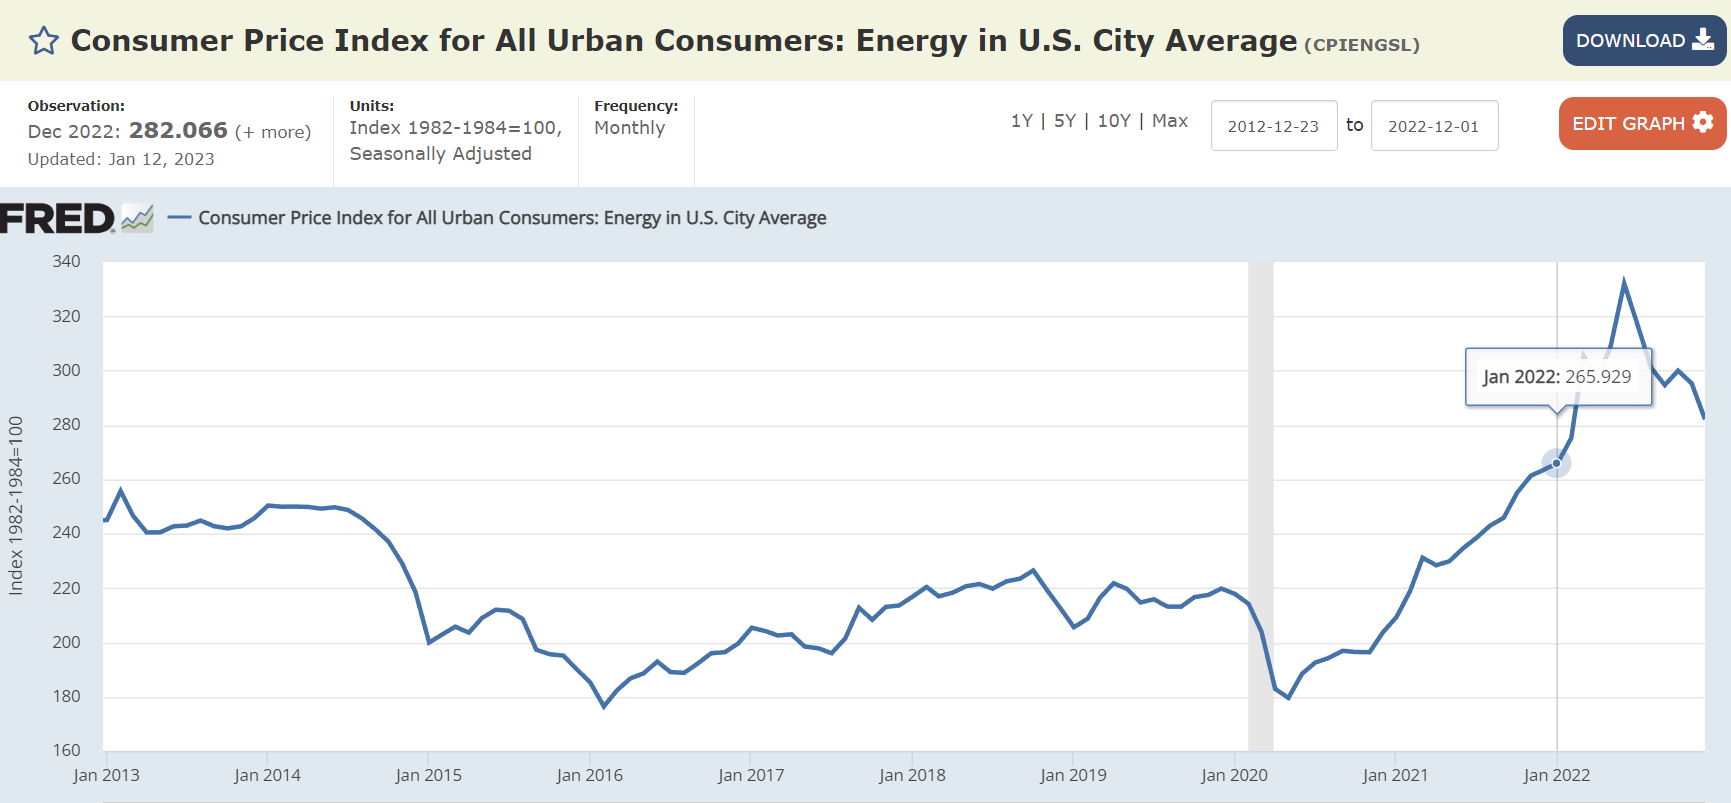
If the energy component is flat MoM in January, the YoY increase will fall to 6.1%. If it’s flat from now until March, the YoY number would flip deep into negative territory with a decline to -7.7%. So, barring some black swan energy event, we’ll be looking at deflation in this category as well within the next few months.
Just as energy and manufacturing-related components are in or nearing deflation territory, there are a couple areas that are still propping up total CPI.
First, the shelter component of CPI, which makes up about 33% of the entire index, is still stubbornly moving higher. December’s shelter data came in 0.8% higher MoM, and 7.5% YoY, so this was clearly a big factor in core CPI’s monthly increase. As I’ve noted many times, the CPI shelter component is a loosely correlated metric to gauge real estate prices, and it has a history of being relatively inaccurate. Even as actual home and rent prices fall, it’s hard to tell what CPI shelter will do. However, the market watches CPI, no matter how reliable the components are, so we have to, too.
Second, food prices are remaining high, as December showed a 0.3% increase MoM and a jump of 10.4% YoY. Food is about 14% of the total CPI, so it has a big influence over how the total index moves. Along with energy, this is an exceptionally crucial part of inflation in general. About 70% of the US GDP is consumer spending, and when people are constrained by basic necessities like energy and food costs, it results in widespread economic weakness. Right now, it looks like they’re balancing each other out in general.
The Coming Shift In Market Sentiment:
I think we’re going to see a gradual shift in the market’s focus over the course of 2023, which isn’t noticeable yet but probably will be once CPI moves down a couple more percent. That shift will be from CPI to jobs data, meaning the market will slowly start reacting less to CPI releases, and slowly start reacting more to jobless claims and monthly employment reports.
There are a couple reasons this shift will take place.
It’s pretty clear that inflation is on a steady downward path now. The market knows this, and barring a black swan event, we’re going to continue to see auto, home, goods, and energy prices move down throughout the year to pre-covid prices. As we get to higher CPI comps, YoY CPI will move down at an accelerated rate.
Layoffs have become a key theme in the market recently. So far in January, there have been over 30,000 reported layoffs across the US, and hints at thousands more – and we’re only halfway done the month. Most of the layoffs so far have been in tech companies and small businesses, but it’s starting to spread to the financial sector as well: this week alone, Blackrock announced 500 job cuts, and BNY Mellon announced 1,500. Over the coming months, I believe this trend will impact many other sectors as well, and more focus will shift to jobs data.
We’re currently in the “in-between” phase where CPI is coming down and the jobs market is still strong. In my opinion, this is leading a lot of investors to believe 2023 will be a recovery year for the economy. However, as I went over on Monday, there are other signs of deterioration that we’re starting to see, which will get bad before jobs data gets worse. Coincident indicators have been noticeably slowing over the past couple months, and as they begin a faster move down, we’ll likely see the bottom for the market.
It’s never certain what will be the factor to drive the next move, but in the near future there are a couple distinct possibilities.
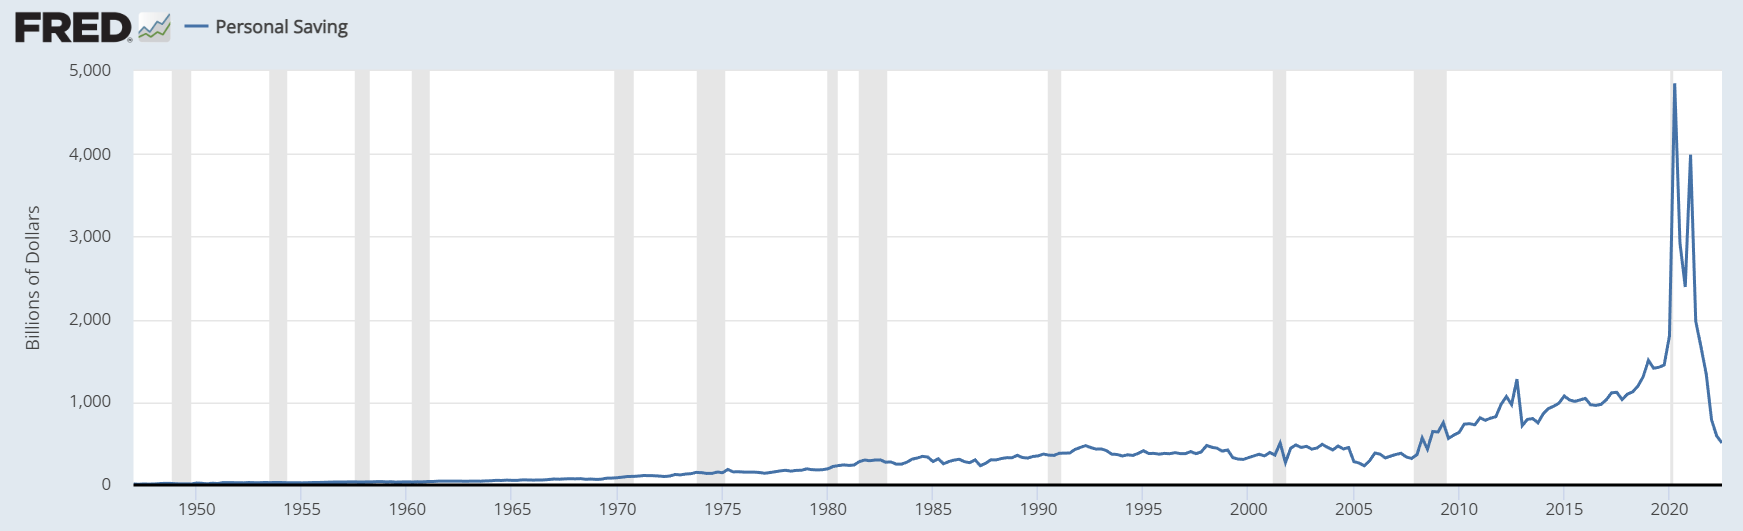
First, as coincident indicators get worse, we’ll see increased layoffs which will hurt consumer spending. This is a very vulnerable spot in the economy right now, as personal saving is at its lowest point since 2008:
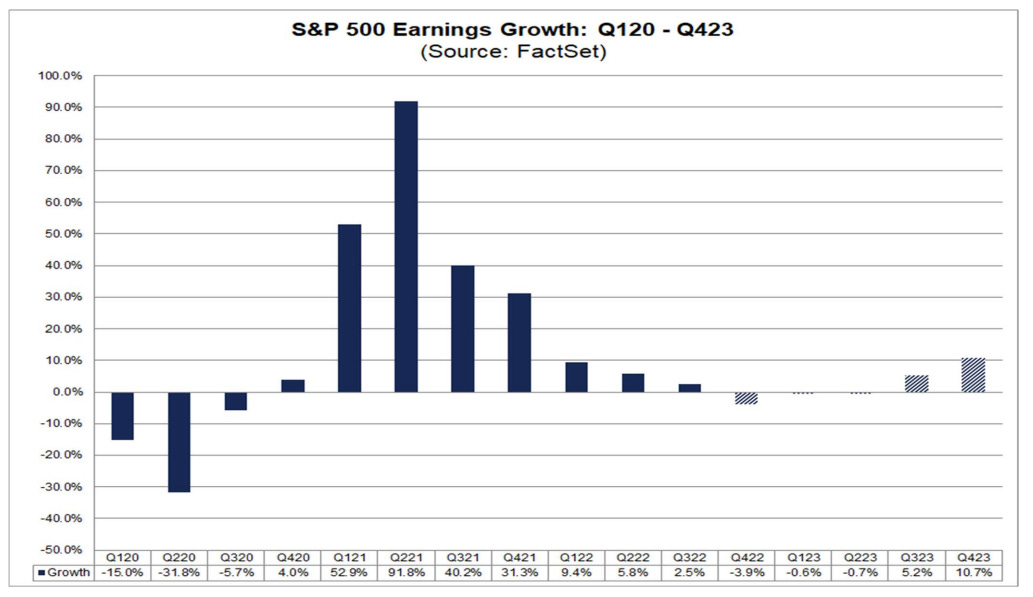
Second, there’s potential for a wave of worse-than-expected earnings reports for Q4 (earnings season starts next week), which could drive another wave of panic into the market. Analyst forecasts for 2023 still show a relatively strong outlook for 2023, with the first half being slightly down and the second half being up significantly:
The occurrence of one or both of these things happening could turn market sentiment around completely, especially considering how the year has started. As always, I’ll keep you up to date with all relevant information as it comes through!
Thank you Ian for all that you do for us! You are very intelligent and well-informed and do a lot of research in the process of helping us to understand the economy etc. I for one appreciate you and your efforts in our behalf. I am so sorry that I do not have a great interest in crypto currencies as an investment and in time I know I will miss out on some amazing gains but I am greatful that I can read your very informative and interesting emails! Thank you again and I do hope that you and your family are blessed in this new Year!