
Will the Fed Make a 180?
Will the Fed Make a 180?
The Fed continues to raise interest rates in unprecedented fashion, but will it pivot?

Today’s hot 🔥 topics 🔥:
· CCJ & MP
· Portfolio Update
· Leading Economic Index Is Down Again
· Outlook on Inflation & Interest Rates
Well, it happened. Once again, the Federal Reserve spooked markets last week with more harsh language and another (expectedly) big rate hike on Thursday.
Today, we’ll get into one indicator I’m seeing that says sentiment is, once again, extremely poor. I’ll also give my outlook on inflation and future Fed actions.
For a quick update, watch the video below. 👇🏻

But first, I want to go over two more companies that are supplying the future of the energy industry: Cameco Corporation (NYSE: CCJ) and MP Materials Corp. (NYSE: MP).
Uranium
We went into the bull case for Uranium last week, but I want to add some more stats to this update that reiterate just how strong the bull case is right now for nuclear fuel on a global scale.
The World Nuclear Association, which tracks a ton of global nuclear data, recently issued its September report.
It showed that there are currently 437 operable nuclear reactors in the world right now — with another 60 under construction. Additionally, there are plans to build another 96 reactors and proposals to build yet another 332.
Granted, a lot of these are still in the early stages, and it isn’t a guarantee that all of them will be completed. But given that many countries are facing serious increases in energy costs — and are likely headed for a painful winter — I believe we’ll see these numbers go even higher in the coming months.
This tweet also sums up the current demand scenario in the uranium market, driven by the sudden resurgence of interest in nuclear power:
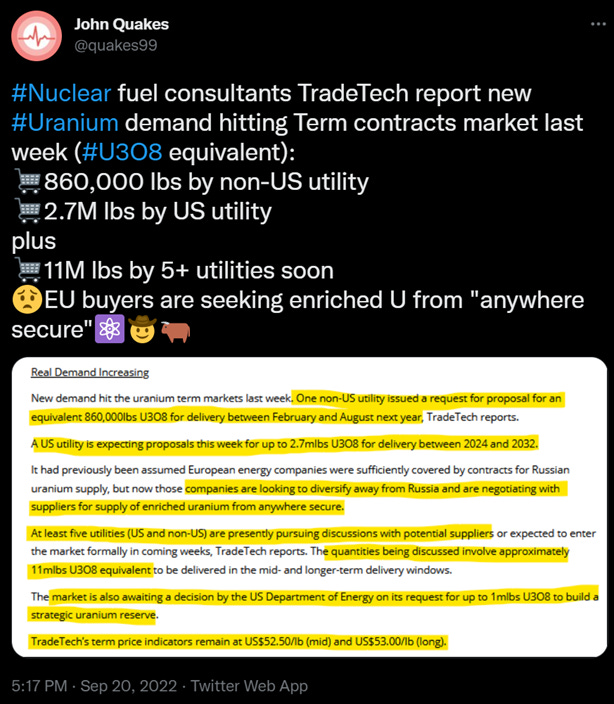
Source: Twitter
Utilities are now ordering uranium deliveries for up to a decade in the future. And I think this will only become more common over the coming months. A massive supply crunch is currently being set up in the uranium market, and we’re prepared for this with our two plays: Energy Fuels Inc. (NYSE: UUUU) and Cameco.
Cameco Corporation
While Energy Fuels is our play on the resurgence of U.S. uranium production, Cameco is our play on the overall market.
In 2021, the total global production of uranium was about 213.1 million pounds. Cameco, the industry titan that it is, accounted for 9% of that total. The company owns some of the most important property on the planet when it comes to uranium mining.
One such property is the Cigar Lake mine in Canada, which is the largest-known high-grade uranium deposit in the world. Cameco has a 50% ownership stake in Cigar Lake as well as 40% ownership of the Inkai-1 mine in Kazakhstan. Kazakhstan is the No. 1 uranium-producing country and has the second top-producing mine on the planet — trailing only Cigar Lake.
Business has certainly boomed for Cameco in 2022. In the first half of the year alone, the company locked in over 45 million pounds worth of uranium supply contracts.
To put that in perspective, that’s over 62% of the global contracts so far this year, which shows that buyers are lining up to do business with Cameco.
Not only is this positive for Cameco, but it’s also positive for the uranium industry as a whole. It shows that buyers are wasting no time locking in prices for future delivery at extremely high volumes.
Cameco’s CEO laid out the magnitude of this demand during their second quarter earnings call, saying “We are seeing governments and companies turn to nuclear with an appetite that I’m not sure I have ever seen in my four decades in this business.”
This is going to lead to a huge increase in the price of uranium, which I expect to happen within the next year or two at the latest.
Knowing the potential of the U.S. when it comes to uranium, Cameco has also been maintaining two mining facilities here: Smith Ranch-Highland in Wyoming and Crow Butte in Nebraska.
While these mines aren’t currently operational, I believe they’ll come back online soon as demand continues to intensify. After all, Cameco spends millions of dollars to keep these mines functional every year, which tells me that it’s worth keeping them ready to use.
This will be a solid boost to the company’s overall production, as it yielded a total of 34.8 million pounds of uranium during its combined 30 years of operations.
Cameco is also in very solid shape financially. Its most recent earnings report shows that it has $1.1 billion in cash compared to just $808 million in debt. Of course, having more cash than debt is always a good thing — especially for a capital-intensive company. The company also has consistently huge cash flow from its operations, which totaled $415.9 million in the past year alone.
Its 2021 revenue was $1.17 billion — the lowest in over 10 years. Due to the unfortunate decline in nuclear power interest during that time, this isn’t much of a surprise.
However, for all the reasons I’ve laid out (and more), it’s very clear that demand is back on the rise. And that will certainly be reflected in Cameco’s revenue going forward.
Want exposure to stocks with rocketing potential? Check out our Gold Membership! It’s packed with stocks that have the potential to bring BIG gains in the course of 3-5 years . . .
Rare Earth Metals
Another commodity that’s critical to the future of energy is rare earth metals. While they don’t get much mainstream attention, these metals are vital to alternative energy products like electric vehicles, wind turbines, and hydrogen fuel cells.
Rare earth metals are known to be able to make the most powerful magnets in the world, and they’re seen as the gold standard when it comes to powering things like electric vehicles and wind turbines. They are also used in healthcare, primarily in MRI imaging, as well as several other industries.
Unfortunately, these share the same situation as lithium and uranium in that global production is very concentrated. Right now, over 60% of rare earth production comes from China, which isn’t exactly ideal from a geopolitical standpoint.
In fact, China just raised its rare earth mining production quota for 2022 to 463 million pounds — up nearly 100 million pounds since 2021.
To give you some more perspective, China produced about 231 million pounds of rare earth metals in 2017. That means if it reaches its quota this year, it’ll be a 100.4% increase in just five years.
Put simply: China knows demand for this commodity is exploding, and it’s taking full advantage.
Now, one main theme that I’m sticking with as part of my 21 Disruptors Index is reshoring — which is part of the broader trend of deglobalization.
As this trend continues to move forward, the U.S. will need to become more self-sufficient. Luckily, the U.S. has rejuvenated a massively crucial part of the rare earth market: the Mountain Pass mine in California.
While China is still far and away the largest producer of rare earth elements on the planet, its market share is dwindling — in large part due to Mountain Pass.
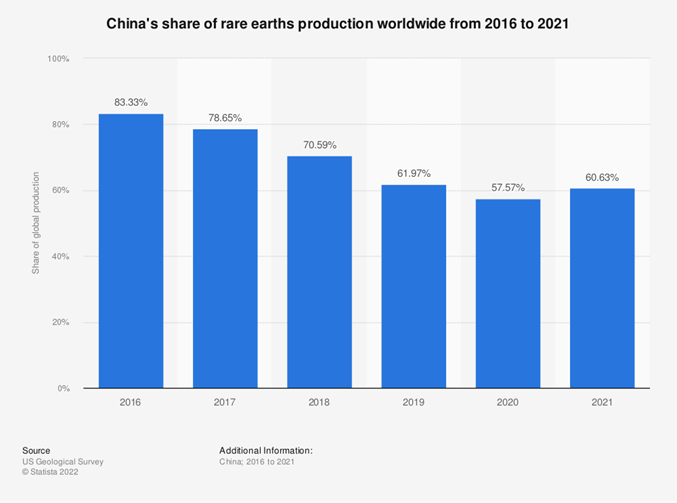
Source: US Geological Survey
This mine is owned by one of our companies: MP Materials.
Mountain Pass
Until recently, the largest rare earth deposit in the U.S. has essentially been a ghost town. The company that owned it filed for bankruptcy in 2015. But MP Materials has completely revived it, bringing back production once again in 2017.
Given the amount of resources that are held within Mountain Pass, it’s hard to state just how important MP Materials is for our position in the global rare earth race.
It’s one thing to say that it’s the biggest producer of rare earth metals in the U.S. (since it’s the only active rare earth mine in the country). However, it’s also by far the largest producer of rare earths outside of China. And from what I could find, there’s only one mine on the planet that produces more: China’s Bayan Obo mine, which accounts for a majority of Chinese production.
You wouldn’t know it by looking at the current landscape, but the U.S. actually used to be the dominant player in rare earth metals. However, over the past four decades, there’s been a major shift in the rare earths market.
As you can see in the chart below, the U.S. dominated the industry — and the Mountain Pass mine was a huge part of global production.

Source: U.S. Geological Survey
Things quickly went downhill in the 1990s for U.S. production. And by the mid-2000s we were out of the game completely.
However, Mountain Pass is returning to form. Even though it was only revived five years ago, it’s already producing significantly more rare earth metals than it did back in its prior glory days. In fact, in 2021, total production at Mountain Pass was 43 million pounds, or 15.52% of global production.
As you can imagine, such a rapid journey to success has created a very encouraging financial situation for MP Materials. Its second quarter earnings report showed that it has over $1.26 billion in cash and just $685 million in debt — of which just $2.4 million is due in the next year.
MP Materials also has very strong cash flow from its operations. In the first half of 2022, it netted almost $220 million. As for sales, in the first half of the year, the company brought in nearly $310 million in revenue — an absurd 133% increase from its revenue in the first half of 2021.
The rise in rare earth metal prices this year has given MP Materials a major boost in funding future expansion. Over the next three years, MP Materials has major plans to expand beyond mining into refining, metallurgy, and magnet making — essentially creating a fully self-sustaining rare earths business.
Performance Update
21 Disruptors Index: -11.03%
S&P 500: -6.24%
Nasdaq: -5.73%
Russell 2000: -9.06%
ARKK: -11.91%
Top 3 Performers:
Bitcoin (BTC): -1.59%
Ethereum (ETH): -2.38%
Cadence Design Systems Inc. (Nasdaq: CDNS): -2.88%
Bottom 3 Performers:
Plug Power Inc. (Nasdaq: PLUG): -21.72%
Desktop Metal Inc. (NYSE: DM): -20.85%
Energy Fuels Inc. (NYSE: UUUU): -19.10%
The past week was another rough one for the markets — especially growth stocks. The 21 Disruptors Index is down over 11% alongside ARKK. The Russell 2000, which is seen as a proxy for small-cap stocks, was also down over 9%.
Meanwhile, Bitcoin (BTC) and Ethereum (ETH) were top performers. Although they were still negative, they held up very well compared to the broader market — especially compared to growth stocks.
This is potentially a very bullish moment for crypto — especially Bitcoin — which has moved hand in hand with the Nasdaq for months now.
I don’t think the Nasdaq will see new highs for a very long time, as it’s top-heavy with companies like Apple Inc. (Nasdaq: AAPL) and Microsoft Corporation (Nasdaq: MSFT) — which are over-owned and continue to trade at historically high multiples.
Down the road, I’m very confident that Bitcoin will make a new high before any of the stock indices.
Conference Board Release
Last Thursday, the Conference Board released its monthly report of leading/coincident/lagging indicators. (I went into detail about these indicators last week, which you can read about here).
The data showed that the Leading Economic Index (LEI) in August was down -0.3% from July, marking its fifth straight monthly decline.
Zooming out a little more, the LEI is now down 2.7% in the past six months. This means we’ve crossed into territory that, in the past, has signaled that a recession is imminent (according to this chart):
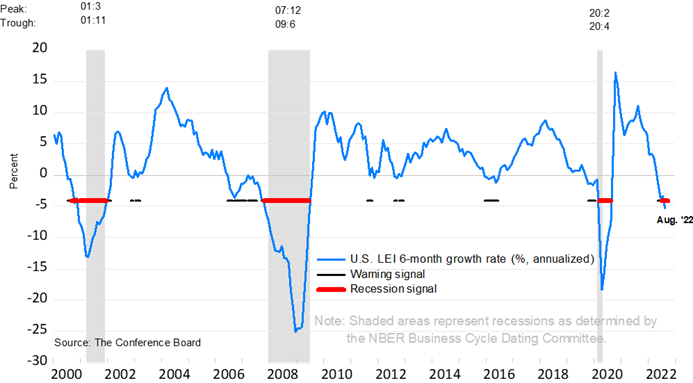
Source: The Conference Board
Meanwhile, the Coincident Economic Index (CEI) and Lagging Economic Index (LAG) continue to act as expected:
· CEI +0.1% in August, +0.6% in the past six months.
· LAG +0.7% in August, +4.4% in the past six months.
Soon, we’ll probably see the CEI consistently go negative — eventually followed by the LAG. By the time the LAG is consistently negative, the market will have already bottomed.
Fed Rate Hike
As you probably know by now, the Federal Reserve officially raised the Fed Funds Rate by yet another 0.75%, putting it into the 3% to 3.25% range. For those who are following along at home, that’s the highest it’s been since March 2008.
It’s no secret that Powell’s No. 1 goal is to kill inflation by any means necessary. And he continues to prove it by hiking rates at a blinding pace.
As a result, we’ve seen a massive sell-off over the past few weeks, completely undoing the rally we saw in July and August.
Back then, the market seemed to think that the Fed might go easy on everyone, as investors took Powell’s magical words “data dependent” as a hint that a pivot was nearby.
Now, it’s increasingly obvious that a pivot isn’t around the corner (well, it depends on what you mean by “pivot”). I went into a few ways it could “pivot” back in this article.
Interest Rate Futures
One area of the market that I find interesting is interest rate futures — not because of their accuracy, but because it gives us good insight about how fearful the market is.
True to their name, interest rate futures show us what the market is expecting interest rates to be at some point in the future (in this case, the Fed Funds Rate).
Over the past couple weeks, there’s been a drastic change in these futures, and it’s now pricing in at least one standard rate hike (0.25%) in 2023. This comes as a bit of a surprise because even as the S&P 500 was crashing in June, the futures’ projection was that the Fed would actually cut rates next year.
As you can see in this chart, it’s been a complete whipsaw for the past five months. It bottomed out in July 2022 around -0.60%, meaning it expected the Fed Funds Rate to go down 0.6% in 2023:
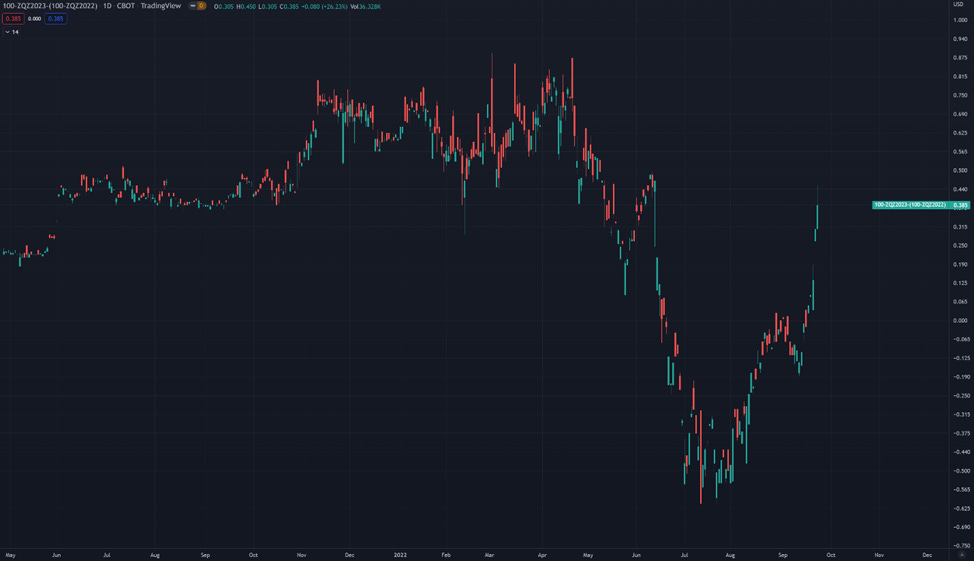
Source: TradingView
However, as of Friday’s close, it’s anticipating the Fed Funds Rate to increase by 0.385% in 2023.
Again, take that with a grain of salt, as it’s constantly changing. But it certainly shows that fear of prolonged rate hikes is growing exponentially.
My Outlook on Inflation & the Fed
One thing that we can keep track of to get a sense of what Powell and friends are thinking is the Core Personal Consumption Expenditures (PCE) data.
PCE is an alternative measure of inflation to the CPI. Like Core CPI, Core PCE is just the total PCE excluding food and energy goods.
We’ll get the PCE data for August this Friday, and I expect it to be similar to what we saw in Core CPI: a big month over month rise compared to July.
Unless that data includes something crazy that wasn’t apparent in the CPI, I don’t think it’ll have an immediate effect on stocks.
In order for discretionary spending to slow more, there either needs to be another surge in energy prices or pain in the jobs market. Of course, neither one of these things are “good.” But so far, there doesn’t seem to be another option.
Considering there are currently almost two job openings for every person looking for a job, I don’t think we’ll see any pain in the job market for at least another four to six months. As for energy prices, another surge could create pain in the job market as companies will have two major things to consider:
1. Higher energy expenses mean less money available to pay employees.
2. Banks are rapidly becoming less willing to lend, reducing companies’ ability to spend extra money on energy/labor.
To that last point, I think the chances of another big rally in oil is a complete toss-up. If energy prices continue to be low, it’s most likely a net-positive for inflation. It’ll put downward pressure on the CPI/PCE data, which I believe outweighs the impact it’d have on discretionary spending — especially if we see weakness in the job market.
The Fed will probably begin to scale down its rate hikes by the end of the year. I doubt there will be another 0.75% raise in November and December.
However, until we see core inflation (discretionary spending) in the CPI and PCE go negative for at least three to four months in a row, I believe it will continue to raise rates in 2023.
That’s it for this week’s update! I hope you enjoyed it. As always, leave any and all questions and comments below.
And don’t forget to subscribe!
If you made it this far, we know you’re #BOP (bullish, optimistic, and positive) on growth stocks and innovation. But have you heard about this one sector with HUGE potential? 👇🏻

Like our politicians, the Feds don't have a clue
One of your best updates, overall...thanks, Ian!